Details
-
Bug
-
Resolution: Cannot Reproduce
-
 Blocker
-
None
-
Lustre 2.12.0
-
None
-
CentOS 7.6, Servers and clients 2.12.0+patches
-
2
-
9223372036854775807
Description
I recently commented in several tickets regarding OSS issues. I think this is some kind of deadlock like we had for Oak in LU-12162 or LU-12018. But we run with 2.12.0+ the patch for LU-12018 (quota: do not start a thread under memory pressure) so I don't think this is the same issue. I tried a SysRq+t and I see a high numbers of threads blocked in ldiskfs. Because the dump took a SUPER long time, and we couldn't wait more, I tried a crash dump but it failed. So I have logs and a partial sysrq-t.
What makes me think of a new deadlock is that the load keeps increasing if the server doesn't crash:
fir-io2-s2: 19:09:23 up 8:45, 1 user, load average: 797.66, 750.86, 519.06
Symptoms can be either this trace like in LU-11644 reported by NASA:
Apr 22 17:12:27 fir-io2-s2 kernel: Pid: 83769, comm: ll_ost01_036 3.10.0-957.1.3.el7_lustre.x86_64 #1 SMP Fri Dec 7 14:50:35 PST 2018
Apr 22 17:12:27 fir-io2-s2 kernel: Call Trace:
Apr 22 17:12:27 fir-io2-s2 kernel: [<ffffffffc1232640>] ptlrpc_set_wait+0x500/0x8d0 [ptlrpc]
Apr 22 17:12:27 fir-io2-s2 kernel: [<ffffffffc11effe5>] ldlm_run_ast_work+0xd5/0x3a0 [ptlrpc]
Apr 22 17:12:27 fir-io2-s2 kernel: [<ffffffffc121169b>] ldlm_glimpse_locks+0x3b/0x100 [ptlrpc]
Apr 22 17:12:27 fir-io2-s2 kernel: [<ffffffffc181310b>] ofd_intent_policy+0x69b/0x920 [ofd]
Apr 22 17:12:27 fir-io2-s2 kernel: [<ffffffffc11f0d26>] ldlm_lock_enqueue+0x366/0xa60 [ptlrpc]
Apr 22 17:12:27 fir-io2-s2 kernel: [<ffffffffc12196d7>] ldlm_handle_enqueue0+0xa47/0x15a0 [ptlrpc]
Apr 22 17:12:27 fir-io2-s2 kernel: [<ffffffffc12a00b2>] tgt_enqueue+0x62/0x210 [ptlrpc]
Apr 22 17:12:27 fir-io2-s2 kernel: [<ffffffffc12a710a>] tgt_request_handle+0xaea/0x1580 [ptlrpc]
Apr 22 17:12:27 fir-io2-s2 kernel: [<ffffffffc124b6db>] ptlrpc_server_handle_request+0x24b/0xab0 [ptlrpc]
Apr 22 17:12:27 fir-io2-s2 kernel: [<ffffffffc124f00c>] ptlrpc_main+0xafc/0x1fc0 [ptlrpc]
Apr 22 17:12:27 fir-io2-s2 kernel: [<ffffffffa90c1c31>] kthread+0xd1/0xe0
Apr 22 17:12:27 fir-io2-s2 kernel: [<ffffffffa9774c24>] ret_from_fork_nospec_begin+0xe/0x21
Apr 22 17:12:27 fir-io2-s2 kernel: [<ffffffffffffffff>] 0xffffffffffffffff
Apr 22 17:12:27 fir-io2-s2 kernel: LustreError: dumping log to /tmp/lustre-log.1555978347.83769
or these network-related messages:
Apr 22 17:12:47 fir-io2-s2 kernel: LustreError: 81272:0:(events.c:450:server_bulk_callback()) event type 5, status -125, desc ffff90da74f1d200
Apr 22 17:12:53 fir-io2-s2 kernel: LustreError: 81276:0:(events.c:450:server_bulk_callback()) event type 5, status -125, desc ffff90fedd133c00
Apr 22 17:12:53 fir-io2-s2 kernel: LustreError: 81276:0:(events.c:450:server_bulk_callback()) event type 5, status -125, desc ffff90fedd133c00

Apr 22 18:48:53 fir-io2-s2 kernel: LustreError: 81277:0:(events.c:450:server_bulk_callback()) event type 5, status -125, desc ffff90e22fd35000
Apr 22 18:48:53 fir-io2-s2 kernel: LustreError: 38519:0:(ldlm_lib.c:3264:target_bulk_io()) @@@ network error on bulk WRITE  req@ffff90e109b76850 x1631329926812992/t0(0) o4->95e6fd6a-706d-ff18-fa02-0b0e9d53d014@10.8.19.8@o2ib6:301/0 lens 488/448 e 0 to 0 dl 1555984331 ref 1 fl Interpret:/0/0 rc 0/0
but clearly it's not a network issue, just a server deadlock. Again, very like the issue on Oak from LU-12162. I'm not sure the list of the tasks provided here is enough to troubleshoot this, but it would be great if you could take a look. This should be considered at least a Sev 2 as we have been pretty much down lately due to this. At the moment, I'm trying to restart without ost quota disabled to see if that's better. Thanks much.
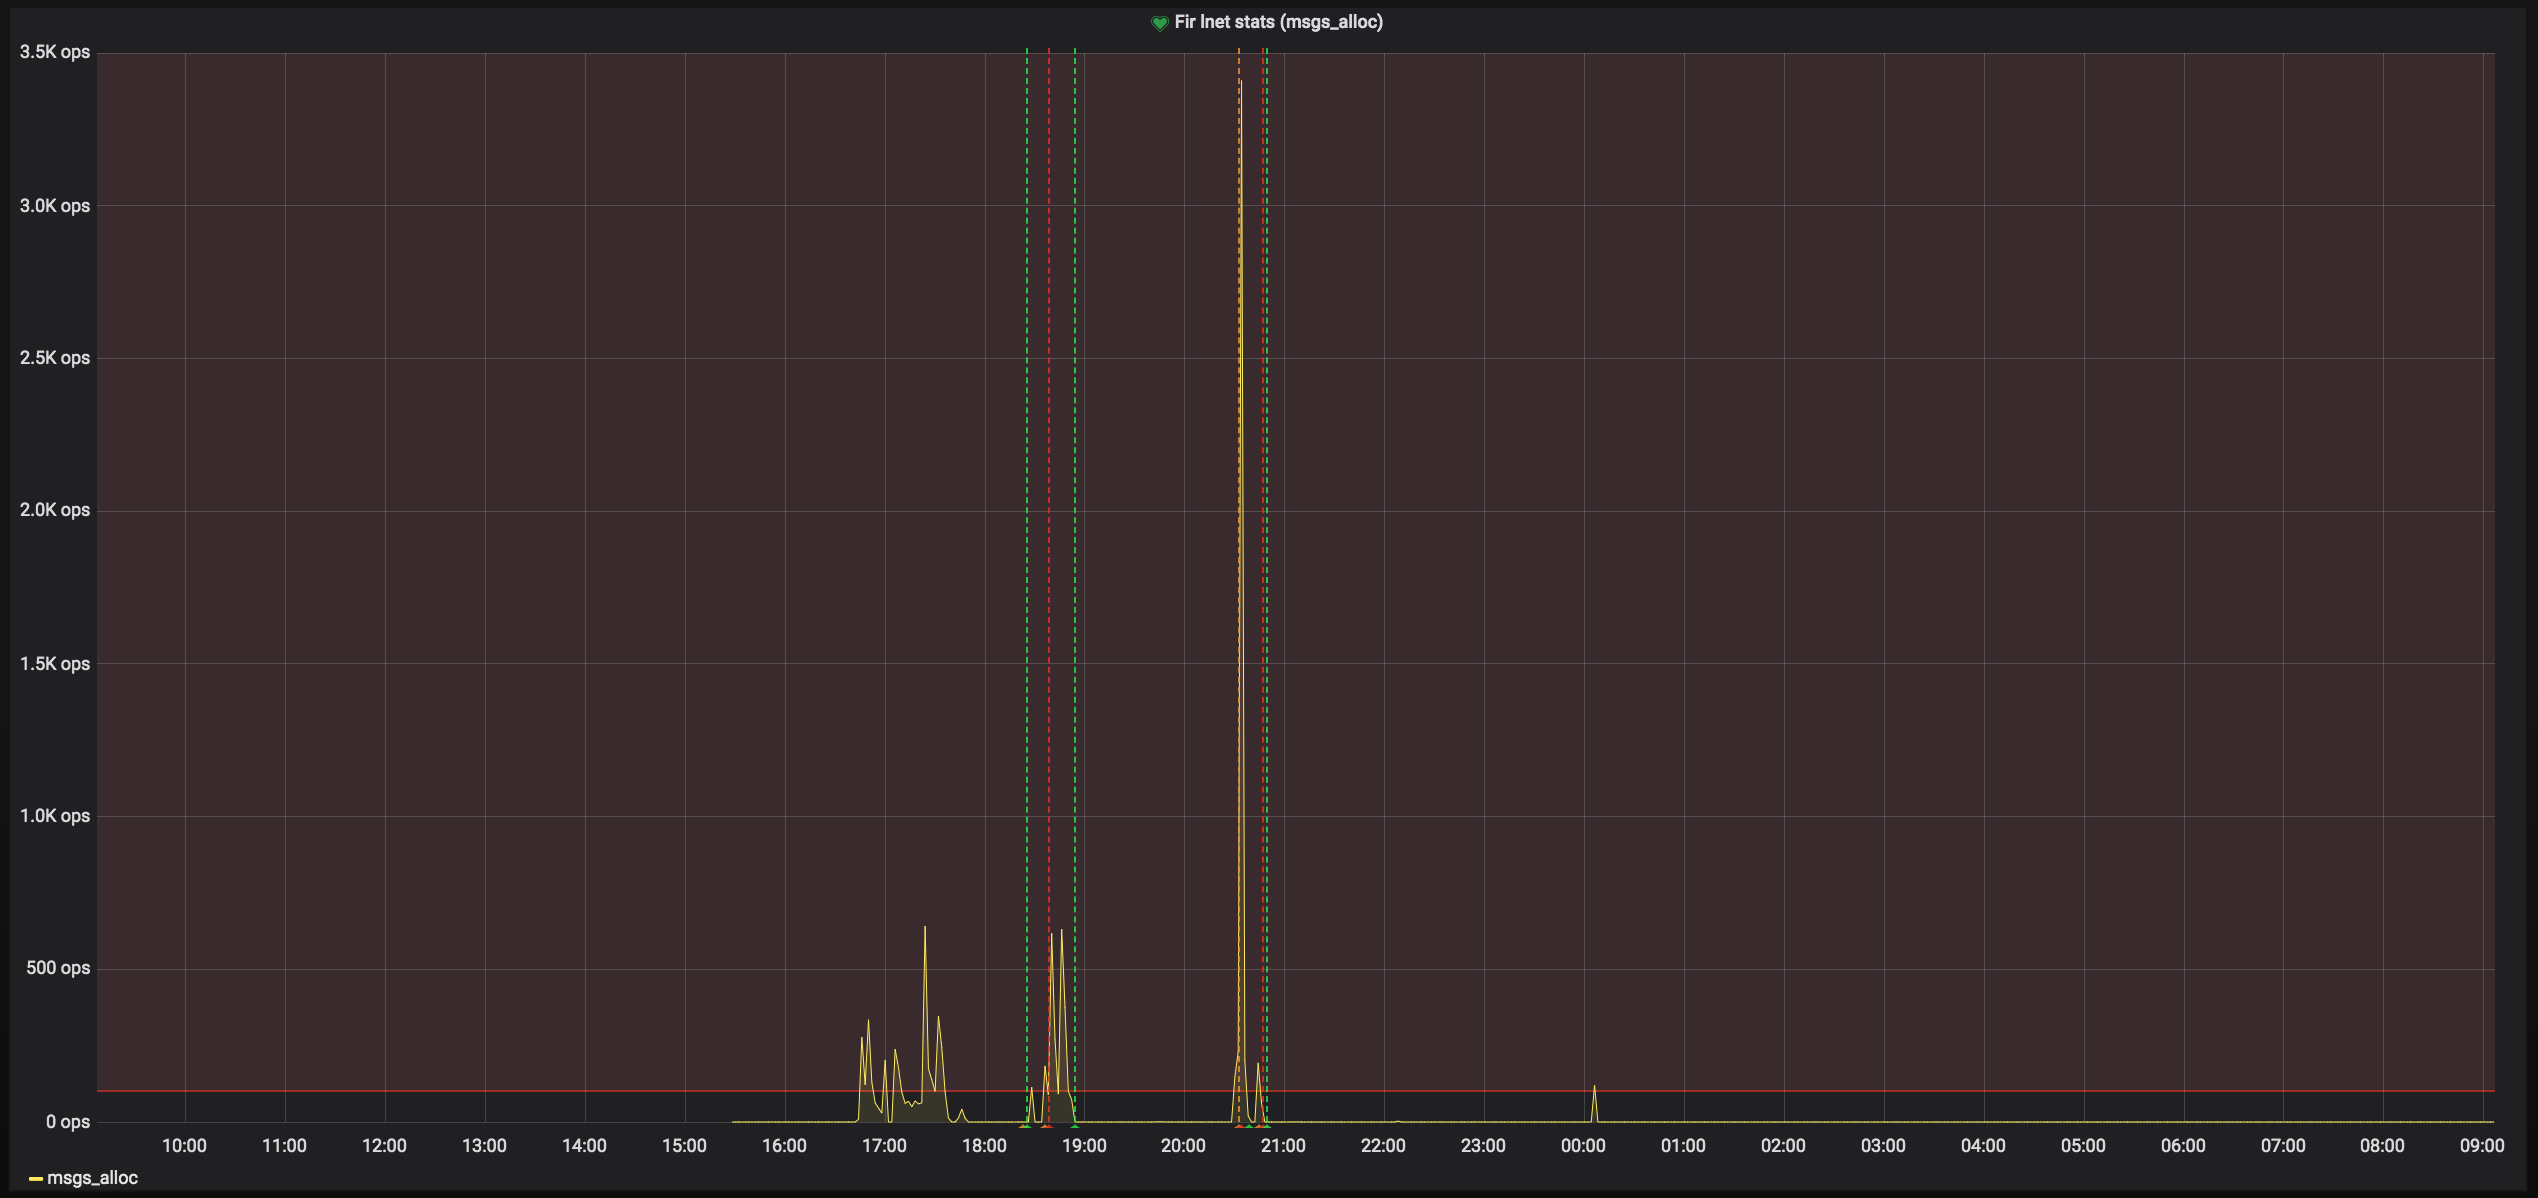
NOTE: we tried to run with net enabled but this doesn't seem to help. also we see a spike in msgs_alloc like NASA but I think it's just due to the deadlock.
Attaching kernel logs + sysrq-t (PARTIAL) as fir-io2-s2_kernel+sysrq_PARTIAL_20190422.log![]()
Attachments
Activity
The lack of peer credits seems to have been a consequence of having enabled lnet debugging. We did some tests with +net at some point but this was a bad idea I guess. Setting debug and subsystem_debug back to -all seems to have fixed it. We're still seeing the following messages but it's hard to tell what could be wrong:
fir-md1-s2: Apr 30 20:23:26 fir-md1-s2 kernel: LNetError: 121174:0:(lib-msg.c:811:lnet_is_health_check()) Msg is in inconsistent state, don't perform health checking (0, 5)
fir-md1-s2: Apr 30 20:23:26 fir-md1-s2 kernel: LNetError: 121174:0:(lib-msg.c:811:lnet_is_health_check()) Skipped 1 previous similar message
fir-md1-s2: Apr 30 20:33:38 fir-md1-s2 kernel: LNetError: 121174:0:(lib-msg.c:811:lnet_is_health_check()) Msg is in inconsistent state, don't perform health checking (0, 5)
fir-md1-s2: Apr 30 20:51:04 fir-md1-s2 kernel: LNetError: 121172:0:(lib-msg.c:811:lnet_is_health_check()) Msg is in inconsistent state, don't perform health checking (0, 5)
fir-md1-s2: Apr 30 21:06:09 fir-md1-s2 kernel: LNetError: 121173:0:(lib-msg.c:811:lnet_is_health_check()) Msg is in inconsistent state, don't perform health checking (0, 5)
fir-md1-s2: Apr 30 21:06:09 fir-md1-s2 kernel: LNetError: 121173:0:(lib-msg.c:811:lnet_is_health_check()) Skipped 3 previous similar messages
fir-md1-s2: Apr 30 21:18:03 fir-md1-s2 kernel: LNetError: 121176:0:(lib-msg.c:811:lnet_is_health_check()) Msg is in inconsistent state, don't perform health checking (0, 5)
fir-md1-s2: Apr 30 21:18:03 fir-md1-s2 kernel: LNetError: 121176:0:(lib-msg.c:811:lnet_is_health_check()) Skipped 1 previous similar message
fir-md1-s2: Apr 30 21:47:15 fir-md1-s2 kernel: LNetError: 121173:0:(lib-msg.c:811:lnet_is_health_check()) Msg is in inconsistent state, don't perform health checking (0, 5)
fir-md1-s2: Apr 30 22:25:11 fir-md1-s2 kernel: LNetError: 121175:0:(lib-msg.c:811:lnet_is_health_check()) Msg is in inconsistent state, don't perform health checking (0, 5)
fir-io1-s2: Apr 30 19:51:58 fir-io1-s2 kernel: LNetError: 108541:0:(lib-msg.c:811:lnet_is_health_check()) Msg is in inconsistent state, don't perform health checking (0, 5)
fir-io1-s2: Apr 30 19:52:03 fir-io1-s2 kernel: LNetError: 108539:0:(lib-msg.c:811:lnet_is_health_check()) Msg is in inconsistent state, don't perform health checking (0, 5)
fir-io1-s2: Apr 30 20:08:25 fir-io1-s2 kernel: LNetError: 108535:0:(lib-msg.c:811:lnet_is_health_check()) Msg is in inconsistent state, don't perform health checking (0, 5)
fir-io1-s2: Apr 30 20:09:26 fir-io1-s2 kernel: LNetError: 108545:0:(lib-msg.c:811:lnet_is_health_check()) Msg is in inconsistent state, don't perform health checking (0, 5)
fir-io1-s2: Apr 30 20:10:03 fir-io1-s2 kernel: LNetError: 108541:0:(lib-msg.c:811:lnet_is_health_check()) Msg is in inconsistent state, don't perform health checking (0, 5)
fir-io1-s2: Apr 30 20:13:34 fir-io1-s2 kernel: LNetError: 108535:0:(lib-msg.c:811:lnet_is_health_check()) Msg is in inconsistent state, don't perform health checking (0, 5)
fir-io1-s2: Apr 30 20:17:04 fir-io1-s2 kernel: LNetError: 108533:0:(lib-msg.c:811:lnet_is_health_check()) Msg is in inconsistent state, don't perform health checking (0, 5)
I see quite a lot of these msgs this morning, on OSS but also on one of our MDS:
Apr 29 09:29:55 fir-md1-s2 kernel: LNetError: 105174:0:(lib-msg.c:811:lnet_is_health_check()) Msg is in inconsistent state, don't perform health checking (0, 5)
Apr 29 10:01:32 fir-md1-s2 kernel: LNetError: 105171:0:(lib-msg.c:811:lnet_is_health_check()) Msg is in inconsistent state, don't perform health checking (0, 5)
Apr 29 11:35:44 fir-md1-s2 kernel: LNetError: 105174:0:(lib-msg.c:811:lnet_is_health_check()) Msg is in inconsistent state, don't perform health checking (-125, 0)
Apr 29 11:35:59 fir-md1-s2 kernel: LNetError: 105169:0:(lib-msg.c:811:lnet_is_health_check()) Msg is in inconsistent state, don't perform health checking (-125, 0)
Apr 29 11:38:34 fir-md1-s2 kernel: LNetError: 105165:0:(lib-msg.c:811:lnet_is_health_check()) Msg is in inconsistent state, don't perform health checking (0, 5)
Apr 29 11:38:52 fir-md1-s2 kernel: LNetError: 105177:0:(lib-msg.c:811:lnet_is_health_check()) Msg is in inconsistent state, don't perform health checking (-125, 0)
Apr 29 11:40:57 fir-md1-s2 kernel: LNetError: 105169:0:(lib-msg.c:811:lnet_is_health_check()) Msg is in inconsistent state, don't perform health checking (-125, 0)
Apr 29 11:41:43 fir-md1-s2 kernel: LNetError: 105167:0:(lib-msg.c:811:lnet_is_health_check()) Msg is in inconsistent state, don't perform health checking (0, 5)
Apr 29 11:42:53 fir-md1-s2 kernel: LNetError: 105169:0:(lib-msg.c:811:lnet_is_health_check()) Msg is in inconsistent state, don't perform health checking (-125, 0)
Apr 29 11:44:39 fir-md1-s2 kernel: LNetError: 105172:0:(lib-msg.c:811:lnet_is_health_check()) Msg is in inconsistent state, don't perform health checking (0, 5)
When enabling +net logging, I see some of the following messages (which are our Lustre routers):
[root@fir-md1-s2 tmp]# strings dk.1556563279 | grep 'no credits' | tail
00000800:00000200:7.0:1556563272.841468:0:105176:0:(o2iblnd_cb.c:894:kiblnd_post_tx_locked()) 10.0.10.210@o2ib7: no credits
00000800:00000200:21.0:1556563272.841474:0:105168:0:(o2iblnd_cb.c:894:kiblnd_post_tx_locked()) 10.0.10.209@o2ib7: no credits
00000800:00000200:29.0:1556563272.841478:0:105169:0:(o2iblnd_cb.c:894:kiblnd_post_tx_locked()) 10.0.10.209@o2ib7: no credits
00000800:00000200:31.0:1556563272.841481:0:105177:0:(o2iblnd_cb.c:894:kiblnd_post_tx_locked()) 10.0.10.210@o2ib7: no credits
00000800:00000200:13.0:1556563272.841481:0:105170:0:(o2iblnd_cb.c:894:kiblnd_post_tx_locked()) 10.0.10.209@o2ib7: no credits
00000800:00000200:45.0:1556563272.841484:0:105171:0:(o2iblnd_cb.c:894:kiblnd_post_tx_locked()) 10.0.10.209@o2ib7: no credits
00000800:00000200:47.0:1556563272.841486:0:105178:0:(o2iblnd_cb.c:894:kiblnd_post_tx_locked()) 10.0.10.210@o2ib7: no credits
00000800:00000200:6.0:1556563272.841486:0:105173:0:(o2iblnd_cb.c:894:kiblnd_post_tx_locked()) 10.0.10.211@o2ib7: no credits
00000800:00000200:21.0:1556563272.841487:0:105168:0:(o2iblnd_cb.c:894:kiblnd_post_tx_locked()) 10.0.10.209@o2ib7: no credits
00000800:00000200:29.0:1556563272.841491:0:105169:0:(o2iblnd_cb.c:894:kiblnd_post_tx_locked()) 10.0.10.209@o2ib7: no credits
Below, o2ib7 is Fir's IB EDR fabric,
10.0.10.5x@o2ib7 are MDS,
10.0.10.1xx@o2ib7 are OSS
10.0.10.2xx@o2ib7 are routers
[root@fir-md1-s2 tmp]# cat /sys/kernel/debug/lnet/nis
nid                      status alive refs peer  rtr   max    tx   min
0@lo                       down     0    2    0    0     0     0     0
0@lo                       down     0    0    0    0     0     0     0
0@lo                       down     0    0    0    0     0     0     0
0@lo                       down     0    0    0    0     0     0     0
10.0.10.52@o2ib7             up    -1   24    8    0    64    56    39
10.0.10.52@o2ib7             up    -1   22    8    0    64    56    24
10.0.10.52@o2ib7             up    -1   23    8    0    64    56    39
10.0.10.52@o2ib7             up    -1   24    8    0    64    56    40

[root@fir-md1-s2 tmp]# cat /sys/kernel/debug/lnet/peers  | grep o2ib7
10.0.10.202@o2ib7           4    up    -1     8     8     8     8 -2451 0
10.0.10.3@o2ib7             1    NA    -1     8     8     8     8     4 0
10.0.10.105@o2ib7           1    NA    -1     8     8     8     8   -39 0
10.0.10.212@o2ib7           8    up    -1     8     8     8     4 -1376 2520
10.0.10.102@o2ib7           1    NA    -1     8     8     8     8   -32 0
10.0.10.204@o2ib7           4    up    -1     8     8     8     8 -3054 0
10.0.10.107@o2ib7           1    NA    -1     8     8     8     8   -40 0
10.0.10.209@o2ib7           5    up    -1     8     8     8     7 -1386 496
10.0.10.201@o2ib7           4    up    -1     8     8     8     8 -2971 0
10.0.10.104@o2ib7           1    NA    -1     8     8     8     8   -40 0
10.0.10.211@o2ib7           8    up    -1     8     8     8     4 -1168 1520
10.0.10.101@o2ib7           1    NA    -1     8     8     8     8   -30 0
10.0.10.203@o2ib7           4    up    -1     8     8     8     8 -2430 0
10.0.10.106@o2ib7           1    NA    -1     8     8     8     8   -36 0
10.0.10.51@o2ib7            1    NA    -1     8     8     8     8  -437 0
10.0.10.103@o2ib7           1    NA    -1     8     8     8     8   -32 0
10.0.10.108@o2ib7           1    NA    -1     8     8     8     8   -33 0
10.0.10.210@o2ib7           5    up    -1     8     8     8     7 -1166 65608
Perhaps we should increase the peer_credits so that our MDS can handle more load to Sherlock's Lnet routers:
    - net type: o2ib7
      local NI(s):
        - nid: 10.0.10.52@o2ib7
          status: up
          interfaces:
              0: ib0
          statistics:
              send_count: 911564827
              recv_count: 916989206
              drop_count: 16536
          tunables:
              peer_timeout: 180
              peer_credits: 8
              peer_buffer_credits: 0
              credits: 256
              peercredits_hiw: 4
              map_on_demand: 0
              concurrent_sends: 0
              fmr_pool_size: 512
              fmr_flush_trigger: 384
              fmr_cache: 1
              ntx: 512
              conns_per_peer: 1
          lnd tunables:
          dev cpt: 2
          tcp bonding: 0
          CPT: "[0,1,2,3]"
But that means we have to change it on the routers too I assume.
Perhaps something is wrong with our lnet config? I attached the output of lnetctl net show -v on:
- Fir servers (1 x IB EDR) as lnet-fir-oss.txt

- Fir(EDR)-Sherlock1(FDR) lnet routers (EDR-FDR) as lnet-sh-rtr-fir-1.txt
- Fir(EDR)-Sherlock2(EDR) lnet routers (EDR-EDR) as lnet-sh-rtr-fir-2.txt
- Sherlock1 client (1xFDR) as lnet-sh-1-fdr.txt
- Sherlock2 client (1xEDR) as lnet-sh-2-edr.txt
We usually don't tune much lnet and try to stick to the default values.
Please note that we're also using the patch from LU-12065 (lnd: increase CQ entries) everywhere now (servers, routers, clients). This one was added following some networking issues on OSS that were tracked in LU-12096.
Yes, I can see many of them actually. An example is attached in fir-io1-s1-previous_bulk.log![]() , just scroll a bit and you'll see. Then we can also see a few backtraces that NASA is seeing too. Looking at the I/O graph during that time, I see a small drop in I/O at the time of the event, and then it recovers.
, just scroll a bit and you'll see. Then we can also see a few backtraces that NASA is seeing too. Looking at the I/O graph during that time, I see a small drop in I/O at the time of the event, and then it recovers.
That's possible. To clarify an earlier question:
Do you see the "-125" error code associated with those messages in earlier instances?
By the way, if you are rebooting clients, is the dip in activity perhaps from the MDS related hang on client loss we've discussed previously that you recently reminded me is still an issue? (Are you still not unmounting on reboot? ![]() )
)
[Edit:]
Actually, the length of the gap mostly rules that out.
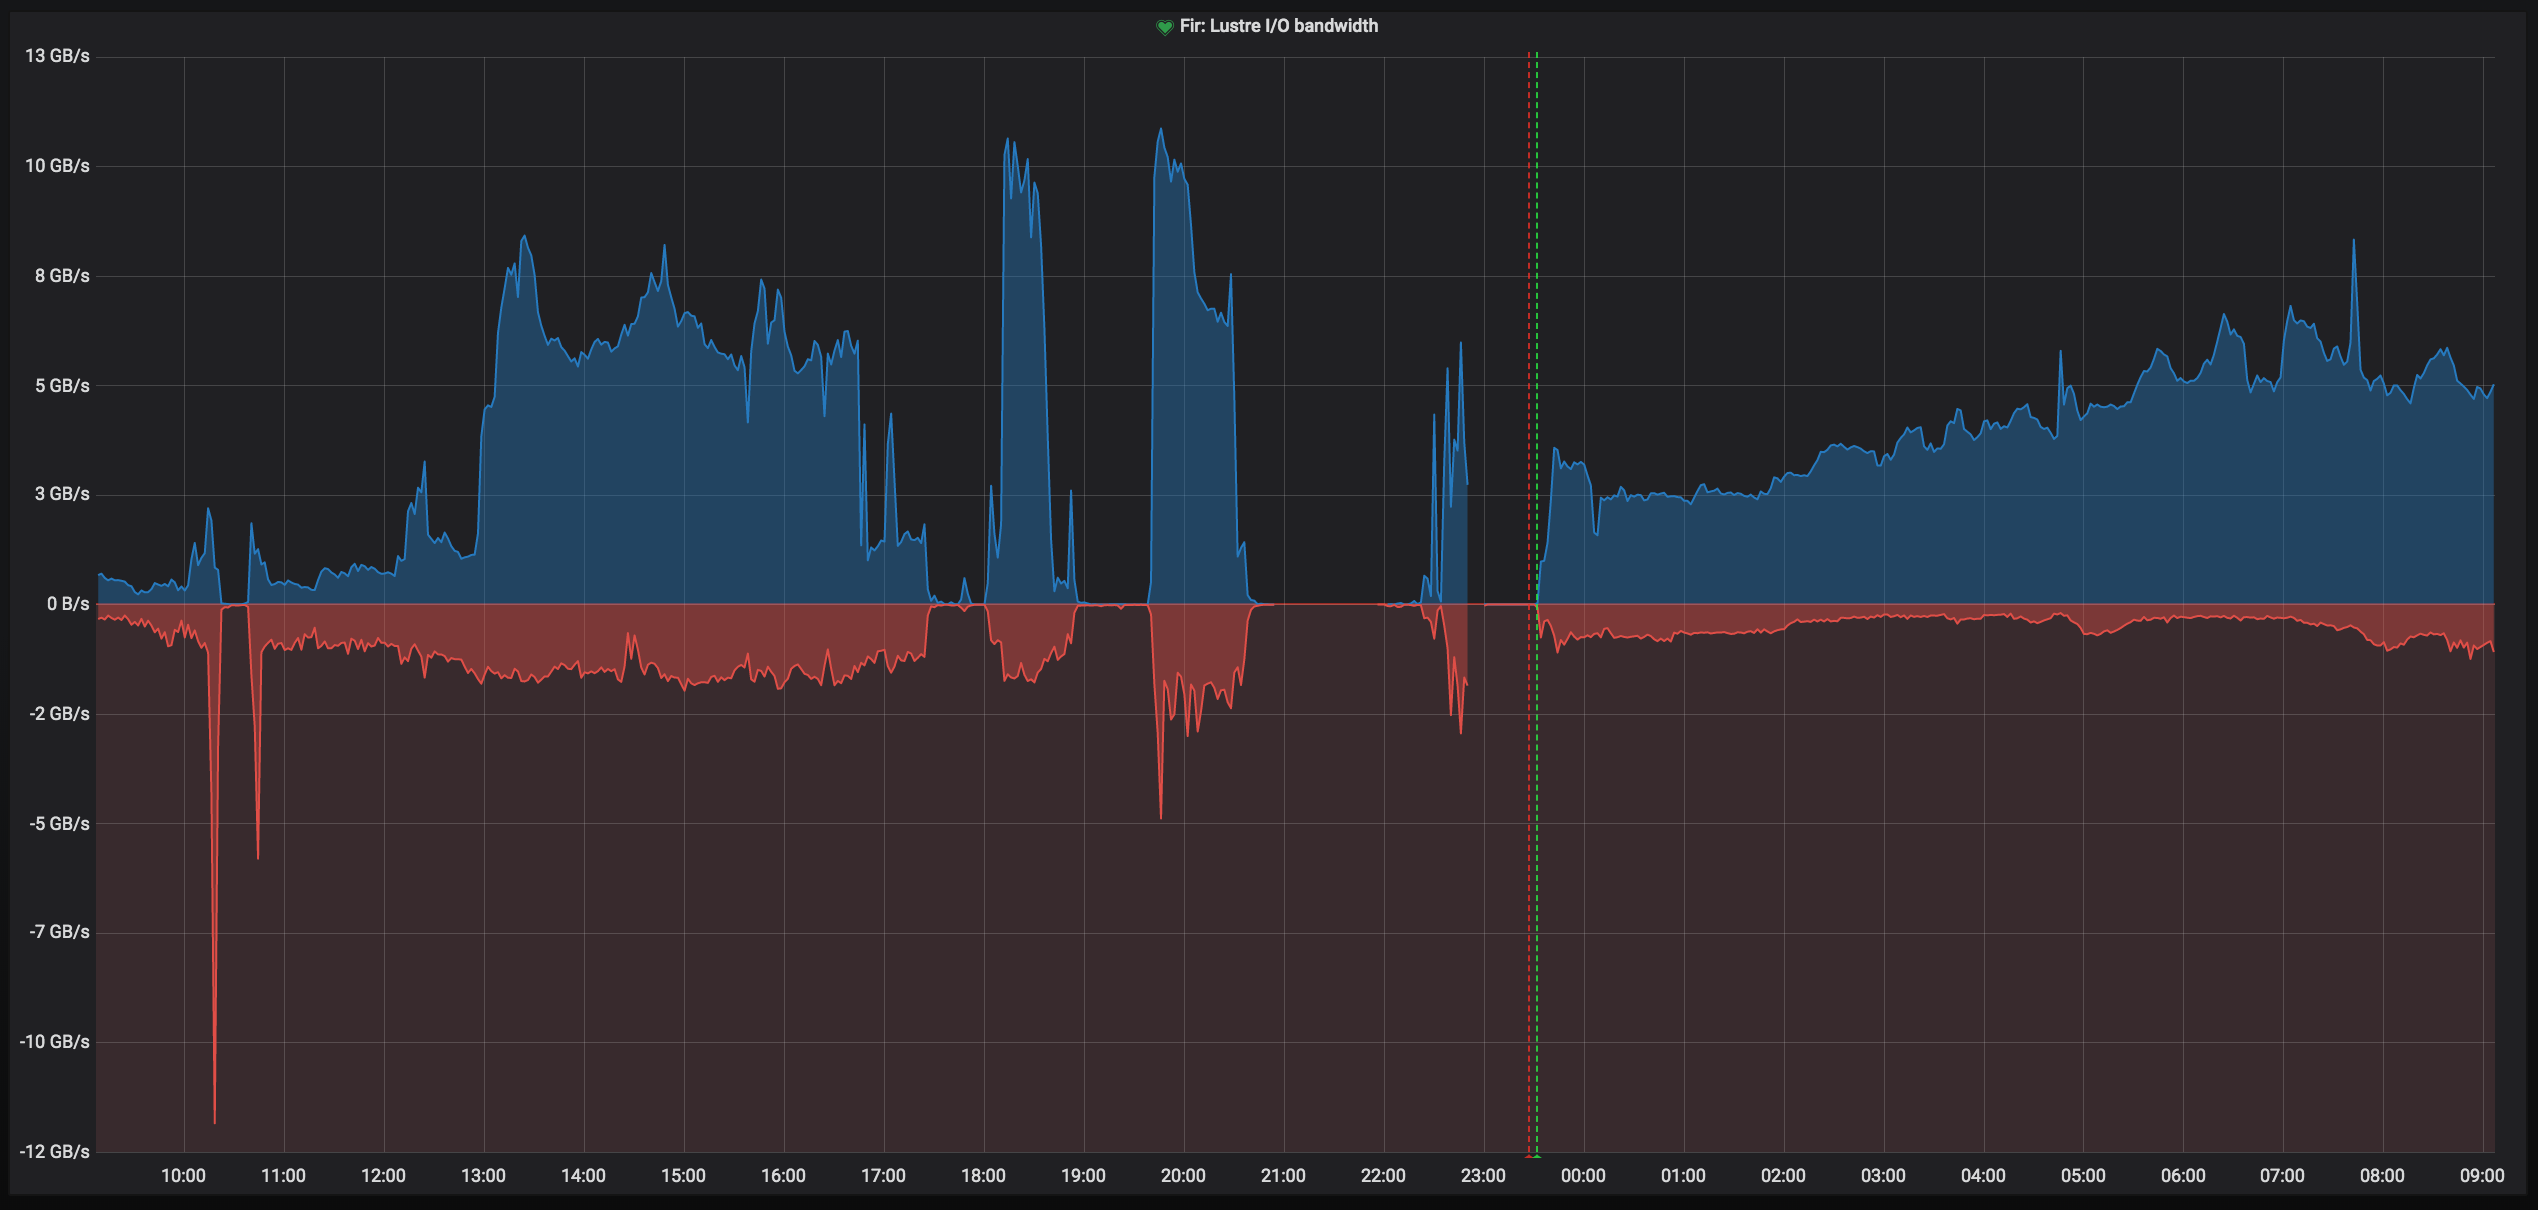
Oops, sorry about that, missing legend... that's bad! ![]() . Overall read I/O from all OSS's are in blue (positive) and write in red (using negative values so it's more readable). They are taken from
. Overall read I/O from all OSS's are in blue (positive) and write in red (using negative values so it's more readable). They are taken from
/proc/fs/lustre/obdfilter/-OST/stats
Curious to know more about the server_bulk_callback errors too.
And you said there was a node "having an enormous amount of trouble doing network communication", are you able to tell me which one? or this information is missing from the logs?
Also just to add more context, we're currently completing a client upgrade to include the patch from "LU-11359 mdt: fix mdt_dom_discard_data() timeouts", so we're rebooting a lot of clients. Perhaps this was a contributing factor too...
Can you help interpret the bandwidth graph? I see positive and negative numbers but I'm not sure what they mean. Is one read and the other write?
About the msg_allocs: While it would be good for Amir to weigh in, I think those are associated with resends due to message failures.
About the -5:
Yes, -5 isn't that rare, but I think the -125 error code is? (It would be great to know if I'm wrong about that and it is in fact common.)
Hi Patrick,
Thanks SO much for having a look at this so quickly! Ok, I may have been confused with the previous deadlock that we have seen. And duly noted for osd_ldiskfs/ldiskfs, thanks!
I've looked a bit further at the logs from last night, and I see one occurrence of event type 5 (multiple messages on each OSS but nothing like before), and it happened on all OSS at the same time. But it looks like it's just a client timing out:
[root@fir-hn01 sthiell.root]# clush -w@oss journalctl -kn 10000 \| grep server_bulk_callback \| tail -1
fir-io3-s2: Apr 23 00:07:24 fir-io3-s2 kernel: LustreError: 95122:0:(events.c:450:server_bulk_callback()) event type 5, status -125, desc ffff8ef1f90a4e00
fir-io3-s1: Apr 23 00:07:24 fir-io3-s1 kernel: LustreError: 108580:0:(events.c:450:server_bulk_callback()) event type 5, status -125, desc ffff8969ed6f0200
fir-io4-s2: Apr 23 00:07:25 fir-io4-s2 kernel: LustreError: 74909:0:(events.c:450:server_bulk_callback()) event type 5, status -125, desc ffff9e65a0062600
fir-io2-s2: Apr 23 00:07:24 fir-io2-s2 kernel: LustreError: 100670:0:(events.c:450:server_bulk_callback()) event type 5, status -125, desc ffff9c2062801e00
fir-io4-s1: Apr 23 00:07:25 fir-io4-s1 kernel: LustreError: 76336:0:(events.c:450:server_bulk_callback()) event type 5, status -125, desc ffff9b56df6bca00
fir-io1-s2: Apr 23 00:07:24 fir-io1-s2 kernel: LustreError: 108542:0:(events.c:450:server_bulk_callback()) event type 5, status -125, desc ffff98ba981c0200
fir-io2-s1: Apr 23 00:07:24 fir-io2-s1 kernel: LustreError: 99911:0:(events.c:450:server_bulk_callback()) event type 5, status -125, desc ffff9a85ce362800
fir-io1-s1: Apr 23 00:07:24 fir-io1-s1 kernel: LustreError: 102249:0:(events.c:450:server_bulk_callback()) event type 5, status -125, desc ffff9416e9788800


Logs on one OSS:

Apr 23 00:06:20 fir-io3-s2 kernel: Lustre: fir-OST001d: Client 6ea99810-c4ef-751c-68b4-b60bb649210c (at 10.8.8.35@o2ib6) reconnecting
Apr 23 00:06:20 fir-io3-s2 kernel: Lustre: Skipped 1 previous similar message
Apr 23 00:06:21 fir-io3-s2 kernel: Lustre: 123046:0:(client.c:2132:ptlrpc_expire_one_request()) @@@ Request sent has timed out for sent delay: [sent 1556003174/real 0]  req@ffff8f14d87f3c00 x1631583327882336/t0(0) o104->fir-OST0023@10.8.1.26@o2ib6:15/16 lens 296/224 e 0 to 1 dl 1556003181 ref 2 fl Rpc:X/0/ffffffff r
Apr 23 00:06:21 fir-io3-s2 kernel: Lustre: 123046:0:(client.c:2132:ptlrpc_expire_one_request()) Skipped 1 previous similar message
Apr 23 00:06:22 fir-io3-s2 kernel: LNetError: 95119:0:(lib-msg.c:811:lnet_is_health_check()) Msg is in inconsistent state, don't perform health checking (-125, 0)
Apr 23 00:06:22 fir-io3-s2 kernel: LustreError: 95120:0:(events.c:450:server_bulk_callback()) event type 5, status -125, desc ffff8ef2ceb77800
Apr 23 00:06:22 fir-io3-s2 kernel: LustreError: 95120:0:(events.c:450:server_bulk_callback()) event type 5, status -125, desc ffff8ef2ceb77800
Apr 23 00:06:22 fir-io3-s2 kernel: LustreError: 95120:0:(events.c:450:server_bulk_callback()) event type 5, status -125, desc ffff8ef2ceb77800
Apr 23 00:06:22 fir-io3-s2 kernel: LustreError: 95120:0:(events.c:450:server_bulk_callback()) event type 5, status -125, desc ffff8ed50ad20600
Apr 23 00:06:22 fir-io3-s2 kernel: LustreError: 95120:0:(events.c:450:server_bulk_callback()) event type 5, status -125, desc ffff8ed50ad20600
Apr 23 00:06:22 fir-io3-s2 kernel: Lustre: fir-OST001d: Bulk IO write error with f2a4d35e-05ff-fe02-d6c7-6c183d27b8a1 (at 10.8.8.29@o2ib6), client will retry: rc = -110
Apr 23 00:06:22 fir-io3-s2 kernel: LNetError: 95119:0:(lib-msg.c:811:lnet_is_health_check()) Skipped 5 previous similar messages
Apr 23 00:06:22 fir-io3-s2 kernel: LustreError: 95119:0:(events.c:450:server_bulk_callback()) event type 5, status -125, desc ffff8ef2ceb77800
Apr 23 00:06:23 fir-io3-s2 kernel: Lustre: fir-OST0019: Client 057a35ee-7eb3-cd47-7142-9e6ee9c8aa59 (at 10.8.13.7@o2ib6) reconnecting
Apr 23 00:06:23 fir-io3-s2 kernel: Lustre: Skipped 4 previous similar messages
Apr 23 00:06:27 fir-io3-s2 kernel: LNetError: 95120:0:(lib-msg.c:811:lnet_is_health_check()) Msg is in inconsistent state, don't perform health checking (-125, 0)
Apr 23 00:06:27 fir-io3-s2 kernel: LustreError: 95117:0:(events.c:450:server_bulk_callback()) event type 5, status -125, desc ffff8ef08388e800
Apr 23 00:06:27 fir-io3-s2 kernel: LustreError: 95117:0:(events.c:450:server_bulk_callback()) event type 5, status -125, desc ffff8eeaf3f75800
Apr 23 00:06:27 fir-io3-s2 kernel: LustreError: 95117:0:(events.c:450:server_bulk_callback()) event type 5, status -125, desc ffff8eeaf3f75800
Apr 23 00:06:27 fir-io3-s2 kernel: LustreError: 95117:0:(events.c:450:server_bulk_callback()) event type 5, status -125, desc ffff8eeaf3f75800
Apr 23 00:06:27 fir-io3-s2 kernel: LustreError: 95117:0:(events.c:450:server_bulk_callback()) event type 5, status -125, desc ffff8eeaf3f75800
Apr 23 00:06:27 fir-io3-s2 kernel: Lustre: fir-OST001d: Bulk IO write error with f2a4d35e-05ff-fe02-d6c7-6c183d27b8a1 (at 10.8.8.29@o2ib6), client will retry: rc = -110
Apr 23 00:06:27 fir-io3-s2 kernel: Lustre: Skipped 1 previous similar message
Apr 23 00:06:27 fir-io3-s2 kernel: LNetError: 95120:0:(lib-msg.c:811:lnet_is_health_check()) Skipped 5 previous similar messages
Apr 23 00:06:27 fir-io3-s2 kernel: LustreError: 95120:0:(events.c:450:server_bulk_callback()) event type 5, status -125, desc ffff8ef08388e800
Apr 23 00:06:27 fir-io3-s2 kernel: Lustre: fir-OST001d: Client 43d6af20-5e3c-1ef3-577c-0e2086a05c21 (at 10.8.10.14@o2ib6) reconnecting
Apr 23 00:06:27 fir-io3-s2 kernel: Lustre: Skipped 2 previous similar messages
Apr 23 00:06:40 fir-io3-s2 kernel: Lustre: fir-OST0023: Client 38fc721f-2581-5cc7-2331-7b71af28244a (at 10.8.7.30@o2ib6) reconnecting
Apr 23 00:06:40 fir-io3-s2 kernel: Lustre: Skipped 4 previous similar messages
Also, I have looked at past OSS logs, and the event type 5 is actually present pretty often when a client timed out.
Lastly, I'm attaching two graphs, just because I wanted to show you the mess of last evening. First one is the overall OSS I/O bandwidth and the second one is the rate of msgs_alloc (all servers). The small peak around midnight is actually matching event type -5 that I've seen above.
Amir,
Are you able to take a look at this one? The main messages of interest seem to be the bulk callback error and the lnet_is_health_check errors I highlighted.
Stephane,
I'm kind of thinking this specific bug has been overcome by events and is maybe captured elsewhere, as we've worked through various issues recently - Are you still seeing the issues described here?