Details
-
Bug
-
Resolution: Cannot Reproduce
-
 Blocker
-
None
-
Lustre 2.12.0
-
None
-
CentOS 7.6, Servers and clients 2.12.0+patches
-
2
-
9223372036854775807
Description
I recently commented in several tickets regarding OSS issues. I think this is some kind of deadlock like we had for Oak in LU-12162 or LU-12018. But we run with 2.12.0+ the patch for LU-12018 (quota: do not start a thread under memory pressure) so I don't think this is the same issue. I tried a SysRq+t and I see a high numbers of threads blocked in ldiskfs. Because the dump took a SUPER long time, and we couldn't wait more, I tried a crash dump but it failed. So I have logs and a partial sysrq-t.
What makes me think of a new deadlock is that the load keeps increasing if the server doesn't crash:
fir-io2-s2: 19:09:23 up 8:45, 1 user, load average: 797.66, 750.86, 519.06
Symptoms can be either this trace like in LU-11644 reported by NASA:
Apr 22 17:12:27 fir-io2-s2 kernel: Pid: 83769, comm: ll_ost01_036 3.10.0-957.1.3.el7_lustre.x86_64 #1 SMP Fri Dec 7 14:50:35 PST 2018
Apr 22 17:12:27 fir-io2-s2 kernel: Call Trace:
Apr 22 17:12:27 fir-io2-s2 kernel: [<ffffffffc1232640>] ptlrpc_set_wait+0x500/0x8d0 [ptlrpc]
Apr 22 17:12:27 fir-io2-s2 kernel: [<ffffffffc11effe5>] ldlm_run_ast_work+0xd5/0x3a0 [ptlrpc]
Apr 22 17:12:27 fir-io2-s2 kernel: [<ffffffffc121169b>] ldlm_glimpse_locks+0x3b/0x100 [ptlrpc]
Apr 22 17:12:27 fir-io2-s2 kernel: [<ffffffffc181310b>] ofd_intent_policy+0x69b/0x920 [ofd]
Apr 22 17:12:27 fir-io2-s2 kernel: [<ffffffffc11f0d26>] ldlm_lock_enqueue+0x366/0xa60 [ptlrpc]
Apr 22 17:12:27 fir-io2-s2 kernel: [<ffffffffc12196d7>] ldlm_handle_enqueue0+0xa47/0x15a0 [ptlrpc]
Apr 22 17:12:27 fir-io2-s2 kernel: [<ffffffffc12a00b2>] tgt_enqueue+0x62/0x210 [ptlrpc]
Apr 22 17:12:27 fir-io2-s2 kernel: [<ffffffffc12a710a>] tgt_request_handle+0xaea/0x1580 [ptlrpc]
Apr 22 17:12:27 fir-io2-s2 kernel: [<ffffffffc124b6db>] ptlrpc_server_handle_request+0x24b/0xab0 [ptlrpc]
Apr 22 17:12:27 fir-io2-s2 kernel: [<ffffffffc124f00c>] ptlrpc_main+0xafc/0x1fc0 [ptlrpc]
Apr 22 17:12:27 fir-io2-s2 kernel: [<ffffffffa90c1c31>] kthread+0xd1/0xe0
Apr 22 17:12:27 fir-io2-s2 kernel: [<ffffffffa9774c24>] ret_from_fork_nospec_begin+0xe/0x21
Apr 22 17:12:27 fir-io2-s2 kernel: [<ffffffffffffffff>] 0xffffffffffffffff
Apr 22 17:12:27 fir-io2-s2 kernel: LustreError: dumping log to /tmp/lustre-log.1555978347.83769
or these network-related messages:
Apr 22 17:12:47 fir-io2-s2 kernel: LustreError: 81272:0:(events.c:450:server_bulk_callback()) event type 5, status -125, desc ffff90da74f1d200
Apr 22 17:12:53 fir-io2-s2 kernel: LustreError: 81276:0:(events.c:450:server_bulk_callback()) event type 5, status -125, desc ffff90fedd133c00
Apr 22 17:12:53 fir-io2-s2 kernel: LustreError: 81276:0:(events.c:450:server_bulk_callback()) event type 5, status -125, desc ffff90fedd133c00

Apr 22 18:48:53 fir-io2-s2 kernel: LustreError: 81277:0:(events.c:450:server_bulk_callback()) event type 5, status -125, desc ffff90e22fd35000
Apr 22 18:48:53 fir-io2-s2 kernel: LustreError: 38519:0:(ldlm_lib.c:3264:target_bulk_io()) @@@ network error on bulk WRITE  req@ffff90e109b76850 x1631329926812992/t0(0) o4->95e6fd6a-706d-ff18-fa02-0b0e9d53d014@10.8.19.8@o2ib6:301/0 lens 488/448 e 0 to 0 dl 1555984331 ref 1 fl Interpret:/0/0 rc 0/0
but clearly it's not a network issue, just a server deadlock. Again, very like the issue on Oak from LU-12162. I'm not sure the list of the tasks provided here is enough to troubleshoot this, but it would be great if you could take a look. This should be considered at least a Sev 2 as we have been pretty much down lately due to this. At the moment, I'm trying to restart without ost quota disabled to see if that's better. Thanks much.
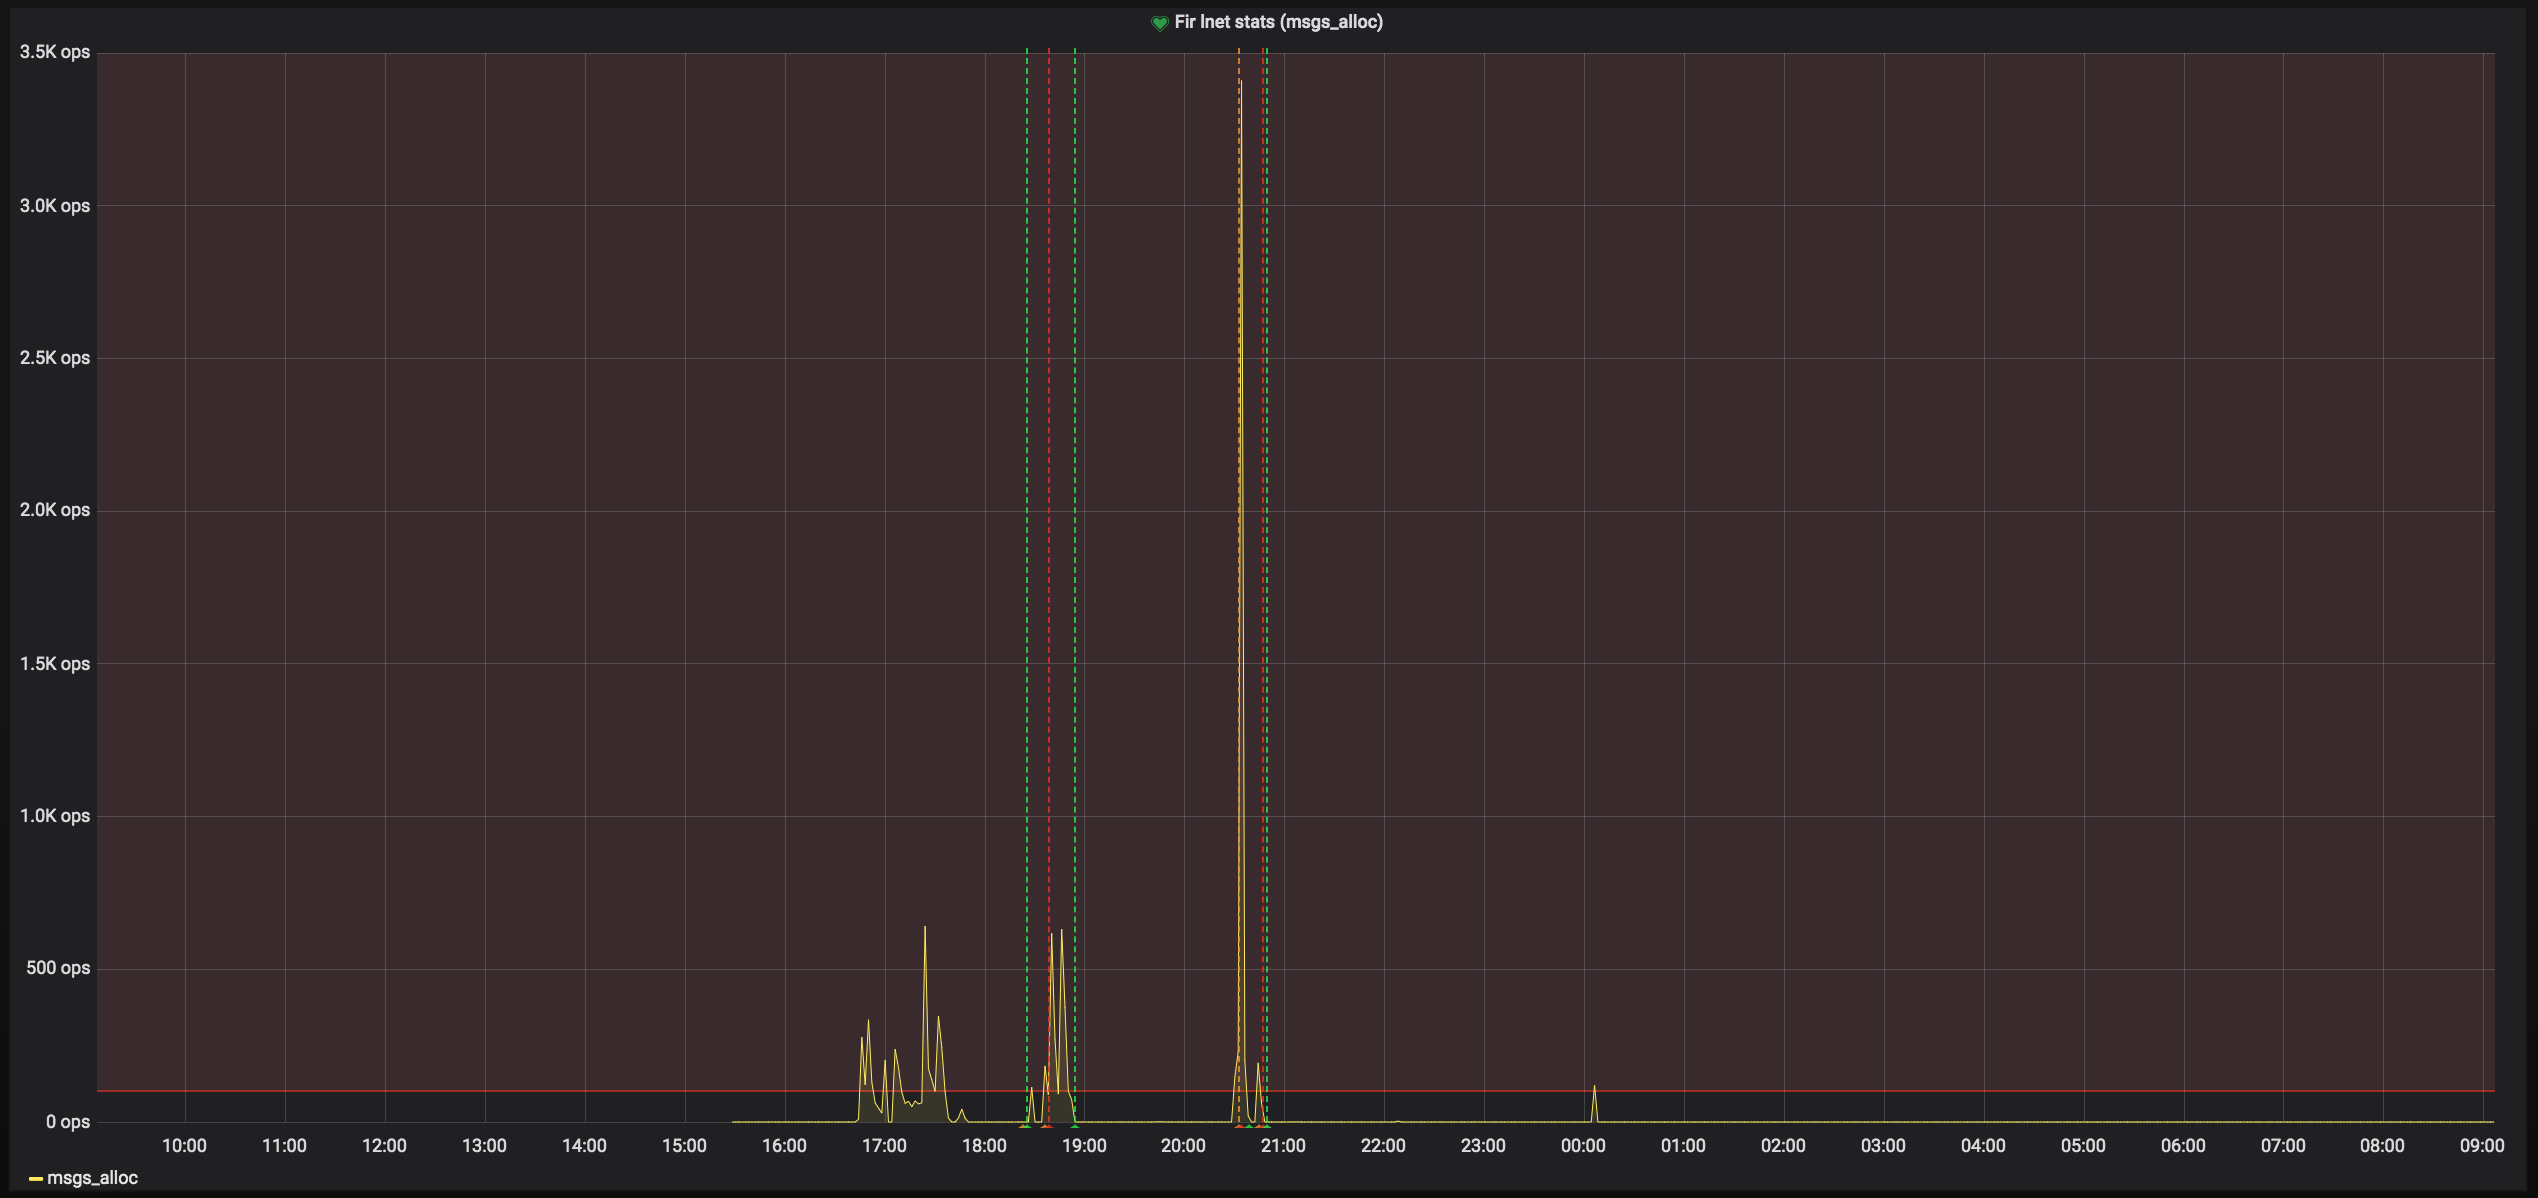
NOTE: we tried to run with net enabled but this doesn't seem to help. also we see a spike in msgs_alloc like NASA but I think it's just due to the deadlock.
Attaching kernel logs + sysrq-t (PARTIAL) as fir-io2-s2_kernel+sysrq_PARTIAL_20190422.log![]()