Details
-
Improvement
-
Resolution: Won't Fix
-
 Blocker
-
None
-
Lustre 2.4.0
-
RHEL 6.2
-
2828
Description
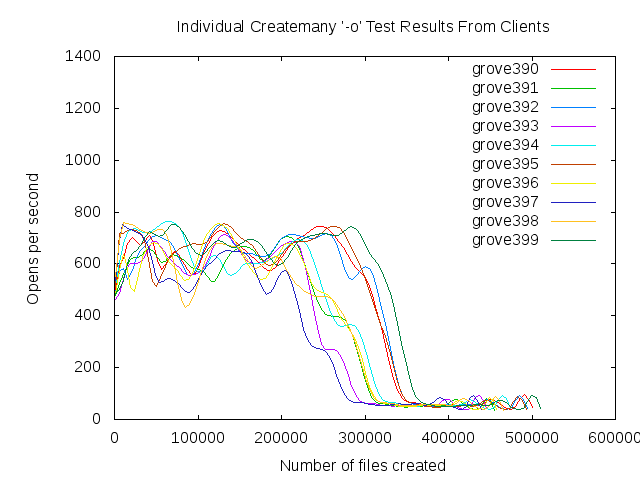
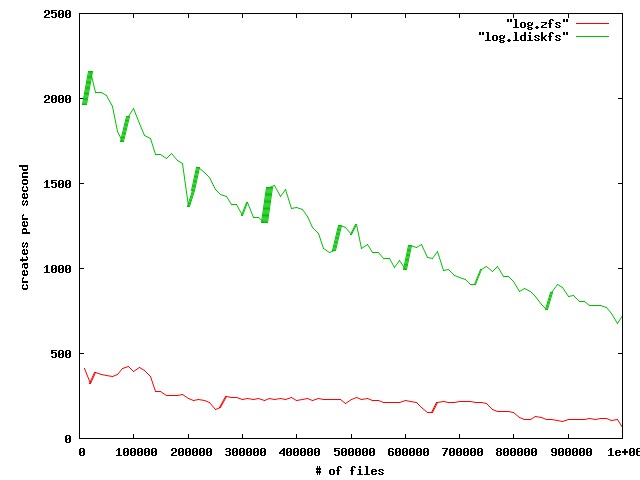
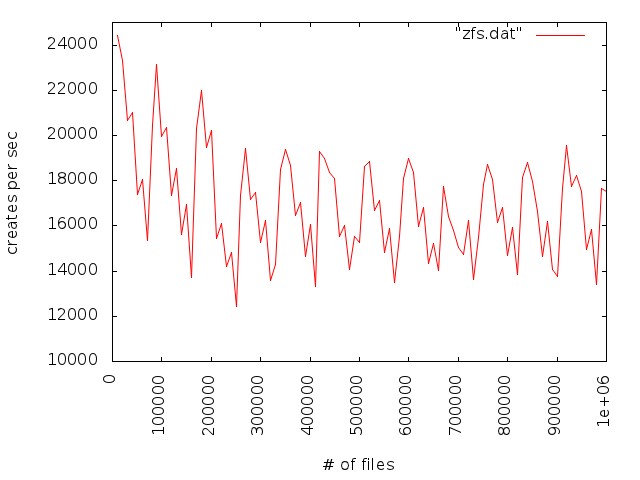
We observe poor file creation rate performance with a zfs backend. The attached jpeg was generated using the createmany benchmark creating 1 million files in a single directory. Files created per second were reported for every 10,000 files created. The green line shows results for Lustre 2.1 and ldiskfs backend. The red line was with ZFS on Orion.
The benchmark was run on the same hardware for both ldisks and ZFS:
MDT: 24 GB RAM, 8 200GB SSD drives in two external SAS-2 enclosures
(Linux MD-RAID10 for ldiskfs, 1 zpool with 8 mirrored pairs for zfs)
OSS: 2 OSS nodes (3 8TB* OSTs each for ldiskfs, 1 72TB OST each for ZFS)
OST: Netapp 60 drive enclosure, 6 24 TB RAID6 LUNs, 3 TB SAS drives, dual 4X QDR IB connections to each OST
Network: 20 Gb/sec 4X DDR IB
*LUNs were partitioned for ldiskfs for compatibility reasons
Attachments
Issue Links
- duplicates
-
LU-2600 lustre metadata performance is very slow on zfs
-

- Resolved
-

Activity
Alex's patch shows good early test results, but isn't yet ready to be landed for the 2.5.0 release. Move this to 2.5.1 so that we will track the patch for landing there if it is ready.
this is not directly related to the problem being discussed, but probably some improvement can be achieved with:
http://review.whamcloud.com/#/c/7157/
I just posted this to the lustre-devel mailing list, and I'll copy/paste it here since I think it's relevant:
I've been looking into improving create rates on one of our ZFS backed
Lustre 2.4 file systems. Currently, when using mds-survey, I can achieve
around a maximum of 10,000 creates per second when using a specially
crafted workload (i.e. using a "small enough" working set and preheating
the cache). If the cache is not hot or the working set is "too large",
the create rates plummet down to around 100 creates per second (that's a
100x difference!).The past week or so I've spent some time trying to dig into exactly what
is going on under the hood, so I can then try to optimize things better
and maintain the 10,000 create per second number.We often see this message in logs:
2013-07-22 11:31:26 Lustre: lcz-OST0000: Slow creates, 640/768 objects created at a rate of 12/sso I started by trying to figure out where the time was being spent in
the precreate call path. On one of the OSS nodes I used ftrace to
profile ofd_precreate_objects() and saw that it took a whopping 22
seconds to complete for the specific call I was looking at! Digging a
little deeper I saw many calls to dt_object_find() which would
degenerate into fzap_lookup()'s and those into dbuf_read()
calls. Some of these dbuf_read() calls took over 600ms to complete
in the trace I was looking at. If we do a dt_object_find() for each
object we're precreating, and each of those causes a dbuf_read()
from disk which could take over half a second to complete, that's a
recipe for terrible create rates.Thus, the two solutions seem to be to either not do the
fzap_lookup() altogether, or make the fzap_lookup() faster. One
way to make it faster is to ensure the call is a ARC hit, rather than it
reading from disk.If I run mds-survey in a loop, with it creating and destroying 10,000
files, each iterations will tend to speed up when compared to the
previous one. For example, iteration 1 will get 100 creates per second,
iteration 2 will get 200 cr/s, iter 3 at 400 cr/s, etc. This trend will
continue up until the iterations hit about 10,000 creates per second,
and will plateau there for awhile, but then drop back down to 100 cr/s
again.The "warm up" period where the rates are increasing during each
iterations I think can be attributed to the cache being cold at the
start of the test. I generally would start after rebooting the OSS
nodes, so they first have to fetch all of the ZAP leaf blocks from disk.
Once they get cached in the ARC, the dbuf_read() calls slowly start
turning into cache hits, speeding up the overall create rates.Now, once the cache is warm, the max create rate is maintained up until
the ARC fills up and begins pitching things from the cache. When this
happens, the create rate goes to shit. I believe this is because we then
start going back to disk to fetch the leaf blocks we just pitched.So why does the ARC fill up in the first place? Looking at the OI ZAP
objects using zdb, they are all only a max size of 32M. Even with 32 of
them, that's only 1G of data which can certainly fit in the ARC (even
with a meta_limit of 3G). What I think is happening, is as the creates
progress, we not only cache the ZAP buffers but also things like dnodes
for the newly create files. The ZAP buffers plus the dnodes (and other
data) does not all fit, causing the ARC to evict our "important" ZAP
buffers. If we didn't evict the ZAP buffers I think we could maintain
the 10,000 cr/s rate.So how do we ensure our "important" data stays in cache? That's an open
question at the moment. Ideally the ARC should be doing this for us. As
we access the same leaf blocks multiple times, it should move that data
to the ARC's MFU and keep it around longer than the dnodes and other
data, but that doesn't seem to be happening.Another place for investigation is into how the OI ZAP's are getting
packed. I think we can do a much better job at ensuring each ZAP leaf
blocked is more full before expanding the ZAP object hash. If you look
at the stats for one of the OI objects on our OSS:Object lvl iblk dblk dsize lsize %full type 150 4 4K 4K 17.1M 32.2M 99.62 ZFS directory 144 bonus System attributes dnode flags: USED_BYTES USERUSED_ACCOUNTED! dnode maxblkid: 8238 path /O/0/d2 uid 0 gid 0 atime Wed Dec 31 16:00:00 1969 mtime Wed Dec 31 16:00:00 1969 ctime Wed Dec 31 16:00:00 1969 crtime Thu Apr 25 15:01:44 2013 gen 80 mode 40755 size 2 parent 147 links 1 pflags 0 rdev 0x0000000000000000 Fat ZAP stats: Pointer table: 16384 elements zt_blk: 5322 zt_numblks: 32 zt_shift: 14 zt_blks_copied: 0 zt_nextblk: 0 ZAP entries: 31349 Leaf blocks: 8175 Total blocks: 8239 zap_block_type: 0x8000000000000001 zap_magic: 0x2f52ab2ab zap_salt: 0x53463a46d Leafs with 2^n pointers: 1: 8158 **************************************** 2: 17 * Blocks with n*5 entries: 0: 5534 **************************************** 1: 2575 ******************* 2: 66 * Blocks n/10 full: 1: 3799 ************************************ 2: 4310 **************************************** 3: 66 * Entries with n chunks: 3: 31349 **************************************** Buckets with n entries: 0: 1015374 **************************************** 1: 30704 ** 2: 321 * 3: 1 *most ZAP leaf blocks have 2 pointers to it and some even have 4!
Ideally, each ZAP leaf would only have a single pointer to it. Also,
none of the leaf blocks are over 40% full, with most being under 30%
full. I think if we did a better job of hashing our creates better into
the ZAP leaf blocks (i.e. more entries per leaf) this would increase our
chance of keeping the "important" leaf blocks in cache for a longer
time.There are still areas I want to investigate (l2arc, MRU vs MFU usage,
ZAP hash uniformity with our inputs), but in the mean time I wanted to
get some of this information out to try and garner some comments.
This bug is for OST object creation performance, LU-2600 is for MDT object create performance. Will likely be fixed together, but may be different in some way.
Roughly, I see about 6500 creates per second from ior when all 768 OST are available on Sequoia. Rates are lower when not all 768 are available.
Christopher, could you describe current status please? any numbers to share?
There is still work needed in this area. Moving to an LU ticket would be fine.
Brian, Ned, do you think we can close the ticket? another option is to make it LU-XXXX
Right, since we have a pretty good idea what's going on here I'd rather see us fix some of the remaining stability issues we've observed through real usage. I'll troll our logs from the last two weeks and email a list which should help you guys prioritize.
Well, we definitely will need to do something about the file create performance. But, Lustre might be off the hook for the time being. From the information we have currently, we'll need to make some modifications on the ZFS backend in order to increase the create rate.
The issue arises when the ZFS ARC is "full" (or hit the metadata limit in this case) and thus needs to start evicting buffers. Since the evict function takes giant locks on the state list mutexes, all other traffic needing to use those state mutexes obviously will block. Lustre doesn't have much say in this matter, so the "fix" will need to come from within ZFS.
One possible solution would be to proactively pitch metadata buffers from the cache when the system is idle. This would give enough free ARC space to allow quick bursts of creates. For example, an application would be able to create ~1M files at the ~6K/s rate. Then in the background, the ARC would be pruned so it doesn't hit the metadata limit (and drop to the slower rate) when the next ~1M burst happens.
Of course this doesn't fix the sustained rate. The fix for that would be much more invasive and would require finer grained locking over the lists.
News from Brian B.:
> It turns out that Lustre's IO pattern on the MDS is very different than what you would normally see through a Posix filesystem. It has exposed some flaws in the way the ZFS ARC manages its cache. The result is a significant decrease in the expected cache hit rate. You can see this effect pretty clearly if you run 'arcstats.py'.
>
> We've been working to resolve this issue for the last few months, and there are proposed patches in the following pull request which should help. They changes themselves are small but the ARC code is subtle so we're in the process of ensuring we didn't hurt other unrelated workloads. Once we're sure the patches are working as expected they'll be merged. This is one of the major things preventing me from making another ZFS tag. This needs to be addressed.
>
> https://github.com/zfsonlinux/zfs/pull/1967