I just posted this to the lustre-devel mailing list, and I'll copy/paste it here since I think it's relevant:
I've been looking into improving create rates on one of our ZFS backed
Lustre 2.4 file systems. Currently, when using mds-survey, I can achieve
around a maximum of 10,000 creates per second when using a specially
crafted workload (i.e. using a "small enough" working set and preheating
the cache). If the cache is not hot or the working set is "too large",
the create rates plummet down to around 100 creates per second (that's a
100x difference!).
The past week or so I've spent some time trying to dig into exactly what
is going on under the hood, so I can then try to optimize things better
and maintain the 10,000 create per second number.
We often see this message in logs:
so I started by trying to figure out where the time was being spent in
the precreate call path. On one of the OSS nodes I used ftrace to
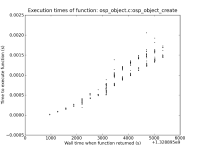
profile ofd_precreate_objects() and saw that it took a whopping 22
seconds to complete for the specific call I was looking at! Digging a
little deeper I saw many calls to dt_object_find() which would
degenerate into fzap_lookup()'s and those into dbuf_read()
calls. Some of these dbuf_read() calls took over 600ms to complete
in the trace I was looking at. If we do a dt_object_find() for each
object we're precreating, and each of those causes a dbuf_read()
from disk which could take over half a second to complete, that's a
recipe for terrible create rates.
Thus, the two solutions seem to be to either not do the
fzap_lookup() altogether, or make the fzap_lookup() faster. One
way to make it faster is to ensure the call is a ARC hit, rather than it
reading from disk.
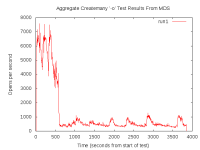
If I run mds-survey in a loop, with it creating and destroying 10,000
files, each iterations will tend to speed up when compared to the
previous one. For example, iteration 1 will get 100 creates per second,
iteration 2 will get 200 cr/s, iter 3 at 400 cr/s, etc. This trend will
continue up until the iterations hit about 10,000 creates per second,
and will plateau there for awhile, but then drop back down to 100 cr/s
again.
The "warm up" period where the rates are increasing during each
iterations I think can be attributed to the cache being cold at the
start of the test. I generally would start after rebooting the OSS
nodes, so they first have to fetch all of the ZAP leaf blocks from disk.
Once they get cached in the ARC, the dbuf_read() calls slowly start
turning into cache hits, speeding up the overall create rates.
Now, once the cache is warm, the max create rate is maintained up until
the ARC fills up and begins pitching things from the cache. When this
happens, the create rate goes to shit. I believe this is because we then
start going back to disk to fetch the leaf blocks we just pitched.
So why does the ARC fill up in the first place? Looking at the OI ZAP
objects using zdb, they are all only a max size of 32M. Even with 32 of
them, that's only 1G of data which can certainly fit in the ARC (even
with a meta_limit of 3G). What I think is happening, is as the creates
progress, we not only cache the ZAP buffers but also things like dnodes
for the newly create files. The ZAP buffers plus the dnodes (and other
data) does not all fit, causing the ARC to evict our "important" ZAP
buffers. If we didn't evict the ZAP buffers I think we could maintain
the 10,000 cr/s rate.
So how do we ensure our "important" data stays in cache? That's an open
question at the moment. Ideally the ARC should be doing this for us. As
we access the same leaf blocks multiple times, it should move that data
to the ARC's MFU and keep it around longer than the dnodes and other
data, but that doesn't seem to be happening.
Another place for investigation is into how the OI ZAP's are getting
packed. I think we can do a much better job at ensuring each ZAP leaf
blocked is more full before expanding the ZAP object hash. If you look
at the stats for one of the OI objects on our OSS:
most ZAP leaf blocks have 2 pointers to it and some even have 4!
Ideally, each ZAP leaf would only have a single pointer to it. Also,
none of the leaf blocks are over 40% full, with most being under 30%
full. I think if we did a better job of hashing our creates better into
the ZAP leaf blocks (i.e. more entries per leaf) this would increase our
chance of keeping the "important" leaf blocks in cache for a longer
time.
There are still areas I want to investigate (l2arc, MRU vs MFU usage,
ZAP hash uniformity with our inputs), but in the mean time I wanted to
get some of this information out to try and garner some comments.
Scott, I'm glad you stumbled upon that pull request. My hope is it will get merged very soon (i.e. this week), and will get some more testing from the ZFS community.
Here at LLNL we're still running a 0.6.2 ZFS release in production, although I'm very anxious to get 0.6.3 tagged and put in production because I think it will alleviate a lot of suffering we see on our ZFS servers.
With that said, I'd love to leverage some more testing if you're willing.
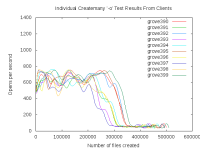
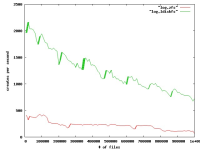
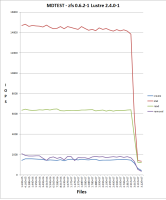
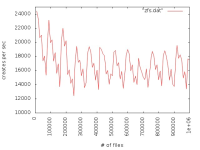
With a "small" test cluster (1 MDS, 8 OSS, 14 clients) running https://github.com/zfsonlinux/zfs/pull/2110, I've managed to create over 800 million files in ~8 days at an average rate of about 1.2K creates per second. Without that pull request, the creates per second drop by a couple orders of magnitude within an hour or so. The clients are running a simple fdtree workload (each within a unique directory): "fdtree -d 10 -l 5 -s 1 -f 10000 -C"
If it's useful, I could try and explain why these ZFS patches help Lustre's particular create workload, but it would take a non-trivial amount of effort to write that up and I'm not sure anybody is really interested. And honestly, although both will benefit, that set of patches will probably help the MDS more so than the OSS.
There's definitely more work that needs to be done in this area, though, so I don't want people to think that landing https://github.com/zfsonlinux/zfs/pull/2110 is the end of the road. Specifically, once the OST's OI's become large enough, I'm constantly seeing ARC misses on the OSS nodes. Those are likely due to fzap operations hitting the disk because the OIs are too large to fit in RAM, but I haven't done enough investigation to know for sure.