Details
-
Improvement
-
Resolution: Won't Fix
-
 Blocker
-
None
-
Lustre 2.4.0
-
RHEL 6.2
-
2828
Description
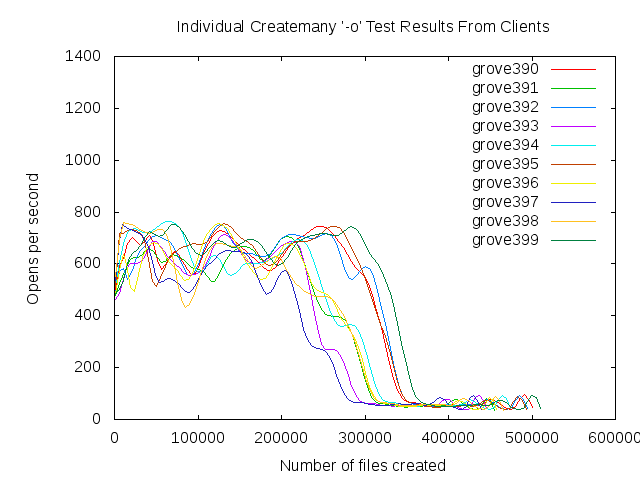
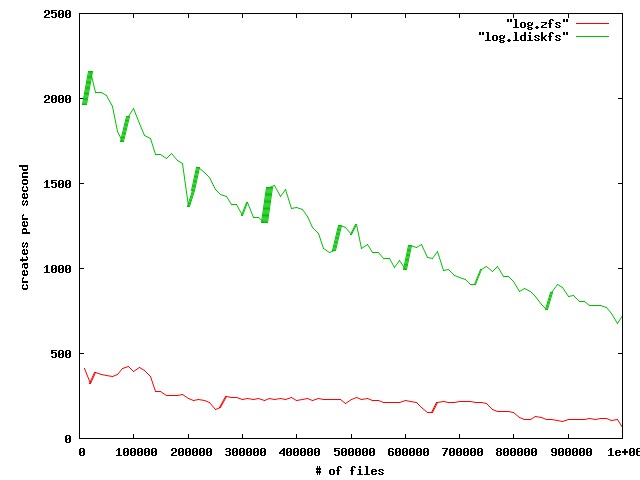
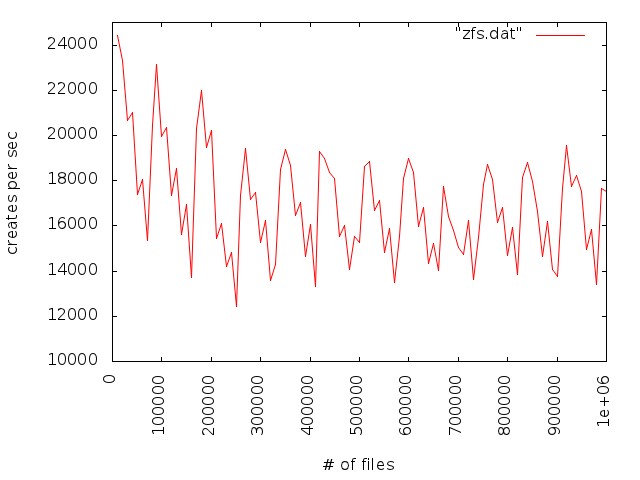
We observe poor file creation rate performance with a zfs backend. The attached jpeg was generated using the createmany benchmark creating 1 million files in a single directory. Files created per second were reported for every 10,000 files created. The green line shows results for Lustre 2.1 and ldiskfs backend. The red line was with ZFS on Orion.
The benchmark was run on the same hardware for both ldisks and ZFS:
MDT: 24 GB RAM, 8 200GB SSD drives in two external SAS-2 enclosures
(Linux MD-RAID10 for ldiskfs, 1 zpool with 8 mirrored pairs for zfs)
OSS: 2 OSS nodes (3 8TB* OSTs each for ldiskfs, 1 72TB OST each for ZFS)
OST: Netapp 60 drive enclosure, 6 24 TB RAID6 LUNs, 3 TB SAS drives, dual 4X QDR IB connections to each OST
Network: 20 Gb/sec 4X DDR IB
*LUNs were partitioned for ldiskfs for compatibility reasons
Attachments
Issue Links
- duplicates
-
LU-2600 lustre metadata performance is very slow on zfs
-

- Resolved
-

Activity
Since the performance you see appears to degrade, and restarting ZFS appears to help things, my guess is you're hitting the same or a very similar we see on our production ZFS filesystems. To double check this, can you run this command on the MDS and post the output (when the system is in the "slow" state):
grep -E "^c|_size|arc_meta_used|arc_meta_limit" /proc/spl/kstat/zfs/arcstats
My guess is the size of the MRU and MFU lists will be very small, while the size of the MRUG and MFUG will be large; but I want to check and make sure.
If we had a way to simply completely reset the arc without restarting the lustre and zfs services, that would be useful.
The very, very ugly hack we have in place at the moment is to drop caches on the MDS once a certain threshold is reached. You can try to run something like this, to see if things go back to the rate you were seeing after a fresh reboot:
for i in `seq 1 10000`; do
    echo 3 > /proc/sys/vm/drop_caches
done
Prakesh,
We can't really do any aggressive testing as this system is in use. However, right now it only has 1 primary user who is populating the file system. Especially once the creates grind down to a trickle, we can have the work halt and do some minor things and restart - naturally they're OK with that as the throughput makes it worthwhile. If there's anything simple we could do or report we will, but probably not patch right now as we're working around the issue.
Regarding, why the patches help lustre's workload – while it's interesting, don't take the effort to write that up on my account.
Just for reference or if it helps in any way, here's what we see and are doing -
We have a system with 1 MDS, 12 OSS. Data is being written to this from existing NFS mounted filesytems (NAS basically). There are I think 6 NAS machines on 1GB or channeled dual 1GB ethernet. These flow through 3 lrouter machines with 10GB ethernet to Infiniband and the servers. We can also test on infiniband connected cluster nodes if needed, but when we see the create problem it of course doesn't matter.
What we saw:
Once our user had everything set and was writing at a reasonable rate, after a week or two file creation went down by a few orders of magnitude, about 2 per second - really bad as noted in this ticket.
On the MDS we noticed txg_sync and arc_adapt particularly busy, but the system cpu mostly idle as also noted above.
To try to at least put the problem off we increased our arc cache settings and restarted, performance was back to normal.
For reference, with mdtest in initial testing we saw around 2000 creates/second. We can't run mdtest right now so we've just been doing simple tests from one node (fdtree is nice by the way), and comparing the same on another zfs backed file system (though not nearly so busy), and a 2.3 ldiskfs based system. This normally gets perhaps 200 to 300 creates per second - all of these file systems are in use, so we can't be too accurate.
After a while performance degraded again, so we stop and restart lustre/zfs on the mds.
I haven't been looking at the OSS's, but just checked and while these do look to have full arc caches, I only see one report in the logs for all servers of slow creates:
Lustre: arcdata-OST001c: Slow creates, 384/512 objects created at a rate of 7/s
So my guess is if these patches help MDS issues more so than OSS, that's at least addressing the more immediate issue for us.
If we had a way to simply completely reset the arc without restarting the lustre and zfs services, that would be useful.
Scott
Alex, I probably could. The test is still running, so I could poke around tomorrow when I get in to the office. I'm also running with the latest ZFS code, so there's a really useful proc file I can use to determine exactly which object(s) it is missing on. Why do you want to know? Understanding the angle you're coming from will help me ensure I gather all the info you need the first time around.
With that said, my guess is it's missing on the precreates. I started the test with an empty filesystem, and at first I saw around 5K creates per second and almost no misses on the MDS or the OSS nodes. After a certain amount of time I began to see a constant ~1% miss rate on the MDS, which actually had a significant affect on the create rate; it brought it down by about 50% to around 2.5K creates per second. After some more time had elapsed, the OSS nodes started to get misses and I began to see the "slow precreate" messages on the OSS node's console. Also, the MDS reads as a whole have become bursty, I see no ARC reads at all on the MDS for seconds at a time. My guess for this is due to the OSS precreates not being able to keep up with the MDS's requests; so while the OSS nodes chug along trying to precreate objects, the MDS sits idle.
I think what's happening now at the tail end of the test, the OSS node's OIs are too large to completely sit in RAM. So when a create happens, it must do a FZAP operation with will hash to a "random" offset into one of the 32 OIs. Since only a portion of the OI can stay resident in RAM, some of these operations will read in a leaf from disk, slowing down the precreate rate and the overall create rate of the test. Once the precreate brings in the leaf, any follow up operations dealing with the same leaf will be a cache hit, until that leaf rolls off the end of the MRU or MFU lists in the ARC.
At least that's my theory based on how I understand all this machinery to work. Unfortunately I haven't gathered any evidence to back this claim up, yet.
Prakash, those ARC misses (on the OSS nodes) .. can you tell whether that happen in the context of object creation or normal read/write/punch ?
Scott, I'm glad you stumbled upon that pull request. My hope is it will get merged very soon (i.e. this week), and will get some more testing from the ZFS community.
Here at LLNL we're still running a 0.6.2 ZFS release in production, although I'm very anxious to get 0.6.3 tagged and put in production because I think it will alleviate a lot of suffering we see on our ZFS servers.
With that said, I'd love to leverage some more testing if you're willing. ![]()
With a "small" test cluster (1 MDS, 8 OSS, 14 clients) running https://github.com/zfsonlinux/zfs/pull/2110, I've managed to create over 800 million files in ~8 days at an average rate of about 1.2K creates per second. Without that pull request, the creates per second drop by a couple orders of magnitude within an hour or so. The clients are running a simple fdtree workload (each within a unique directory): "fdtree -d 10 -l 5 -s 1 -f 10000 -C"
If it's useful, I could try and explain why these ZFS patches help Lustre's particular create workload, but it would take a non-trivial amount of effort to write that up and I'm not sure anybody is really interested. And honestly, although both will benefit, that set of patches will probably help the MDS more so than the OSS.
There's definitely more work that needs to be done in this area, though, so I don't want people to think that landing https://github.com/zfsonlinux/zfs/pull/2110 is the end of the road. Specifically, once the OST's OI's become large enough, I'm constantly seeing ARC misses on the OSS nodes. Those are likely due to fzap operations hitting the disk because the OIs are too large to fit in RAM, but I haven't done enough investigation to know for sure.
I'd like to add that at SSEC we're affected by this with moderate severity, have been following here and on the ZFS side at https://github.com/zfsonlinux/zfs/pull/2110 - We plan on updating ZFS when this is ready for release.
Our system is in production so we'd prefer to wait for the release, but if this is likely to be a matter of months instead of weeks, we may be willing to test the patch.
We are seeing this problem in particular because we are populating a new file system with existing data, lots of writes, so every few days it becomes an issue.
Scott
News from Brian B.:
> It turns out that Lustre's IO pattern on the MDS is very different than what you would normally see through a Posix filesystem. It has exposed some flaws in the way the ZFS ARC manages its cache. The result is a significant decrease in the expected cache hit rate. You can see this effect pretty clearly if you run 'arcstats.py'.
>
> We've been working to resolve this issue for the last few months, and there are proposed patches in the following pull request which should help. They changes themselves are small but the ARC code is subtle so we're in the process of ensuring we didn't hurt other unrelated workloads. Once we're sure the patches are working as expected they'll be merged. This is one of the major things preventing me from making another ZFS tag. This needs to be addressed.
>
> https://github.com/zfsonlinux/zfs/pull/1967
Alex's patch shows good early test results, but isn't yet ready to be landed for the 2.5.0 release. Move this to 2.5.1 so that we will track the patch for landing there if it is ready.
this is not directly related to the problem being discussed, but probably some improvement can be achieved with:
http://review.whamcloud.com/#/c/7157/
I just posted this to the lustre-devel mailing list, and I'll copy/paste it here since I think it's relevant:
I've been looking into improving create rates on one of our ZFS backed
Lustre 2.4 file systems. Currently, when using mds-survey, I can achieve
around a maximum of 10,000 creates per second when using a specially
crafted workload (i.e. using a "small enough" working set and preheating
the cache). If the cache is not hot or the working set is "too large",
the create rates plummet down to around 100 creates per second (that's a
100x difference!).The past week or so I've spent some time trying to dig into exactly what
is going on under the hood, so I can then try to optimize things better
and maintain the 10,000 create per second number.We often see this message in logs:
2013-07-22 11:31:26 Lustre: lcz-OST0000: Slow creates, 640/768 objects created at a rate of 12/sso I started by trying to figure out where the time was being spent in
the precreate call path. On one of the OSS nodes I used ftrace to
profile ofd_precreate_objects() and saw that it took a whopping 22
seconds to complete for the specific call I was looking at! Digging a
little deeper I saw many calls to dt_object_find() which would
degenerate into fzap_lookup()'s and those into dbuf_read()
calls. Some of these dbuf_read() calls took over 600ms to complete
in the trace I was looking at. If we do a dt_object_find() for each
object we're precreating, and each of those causes a dbuf_read()
from disk which could take over half a second to complete, that's a
recipe for terrible create rates.Thus, the two solutions seem to be to either not do the
fzap_lookup() altogether, or make the fzap_lookup() faster. One
way to make it faster is to ensure the call is a ARC hit, rather than it
reading from disk.If I run mds-survey in a loop, with it creating and destroying 10,000
files, each iterations will tend to speed up when compared to the
previous one. For example, iteration 1 will get 100 creates per second,
iteration 2 will get 200 cr/s, iter 3 at 400 cr/s, etc. This trend will
continue up until the iterations hit about 10,000 creates per second,
and will plateau there for awhile, but then drop back down to 100 cr/s
again.The "warm up" period where the rates are increasing during each
iterations I think can be attributed to the cache being cold at the
start of the test. I generally would start after rebooting the OSS
nodes, so they first have to fetch all of the ZAP leaf blocks from disk.
Once they get cached in the ARC, the dbuf_read() calls slowly start
turning into cache hits, speeding up the overall create rates.Now, once the cache is warm, the max create rate is maintained up until
the ARC fills up and begins pitching things from the cache. When this
happens, the create rate goes to shit. I believe this is because we then
start going back to disk to fetch the leaf blocks we just pitched.So why does the ARC fill up in the first place? Looking at the OI ZAP
objects using zdb, they are all only a max size of 32M. Even with 32 of
them, that's only 1G of data which can certainly fit in the ARC (even
with a meta_limit of 3G). What I think is happening, is as the creates
progress, we not only cache the ZAP buffers but also things like dnodes
for the newly create files. The ZAP buffers plus the dnodes (and other
data) does not all fit, causing the ARC to evict our "important" ZAP
buffers. If we didn't evict the ZAP buffers I think we could maintain
the 10,000 cr/s rate.So how do we ensure our "important" data stays in cache? That's an open
question at the moment. Ideally the ARC should be doing this for us. As
we access the same leaf blocks multiple times, it should move that data
to the ARC's MFU and keep it around longer than the dnodes and other
data, but that doesn't seem to be happening.Another place for investigation is into how the OI ZAP's are getting
packed. I think we can do a much better job at ensuring each ZAP leaf
blocked is more full before expanding the ZAP object hash. If you look
at the stats for one of the OI objects on our OSS:Object lvl iblk dblk dsize lsize %full type 150 4 4K 4K 17.1M 32.2M 99.62 ZFS directory 144 bonus System attributes dnode flags: USED_BYTES USERUSED_ACCOUNTED! dnode maxblkid: 8238 path /O/0/d2 uid 0 gid 0 atime Wed Dec 31 16:00:00 1969 mtime Wed Dec 31 16:00:00 1969 ctime Wed Dec 31 16:00:00 1969 crtime Thu Apr 25 15:01:44 2013 gen 80 mode 40755 size 2 parent 147 links 1 pflags 0 rdev 0x0000000000000000 Fat ZAP stats: Pointer table: 16384 elements zt_blk: 5322 zt_numblks: 32 zt_shift: 14 zt_blks_copied: 0 zt_nextblk: 0 ZAP entries: 31349 Leaf blocks: 8175 Total blocks: 8239 zap_block_type: 0x8000000000000001 zap_magic: 0x2f52ab2ab zap_salt: 0x53463a46d Leafs with 2^n pointers: 1: 8158 **************************************** 2: 17 * Blocks with n*5 entries: 0: 5534 **************************************** 1: 2575 ******************* 2: 66 * Blocks n/10 full: 1: 3799 ************************************ 2: 4310 **************************************** 3: 66 * Entries with n chunks: 3: 31349 **************************************** Buckets with n entries: 0: 1015374 **************************************** 1: 30704 ** 2: 321 * 3: 1 *most ZAP leaf blocks have 2 pointers to it and some even have 4!
Ideally, each ZAP leaf would only have a single pointer to it. Also,
none of the leaf blocks are over 40% full, with most being under 30%
full. I think if we did a better job of hashing our creates better into
the ZAP leaf blocks (i.e. more entries per leaf) this would increase our
chance of keeping the "important" leaf blocks in cache for a longer
time.There are still areas I want to investigate (l2arc, MRU vs MFU usage,
ZAP hash uniformity with our inputs), but in the mean time I wanted to
get some of this information out to try and garner some comments.
Alex, Does this get you what you want to see?