Details
-
Improvement
-
Resolution: Won't Fix
-
Blocker
-
None
-
Lustre 2.4.0
-
RHEL 6.2
-
2828
Description
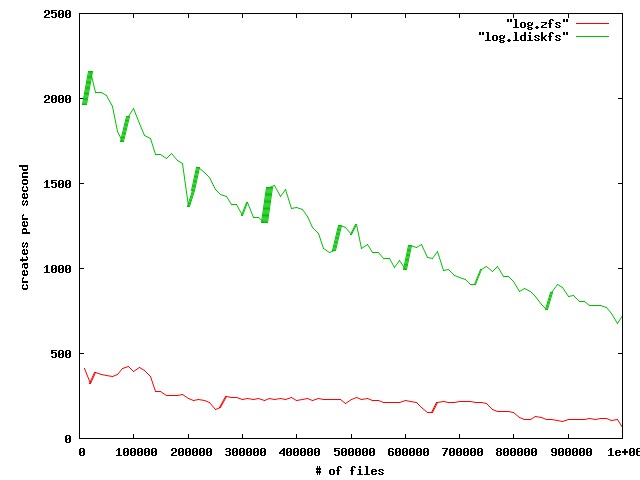
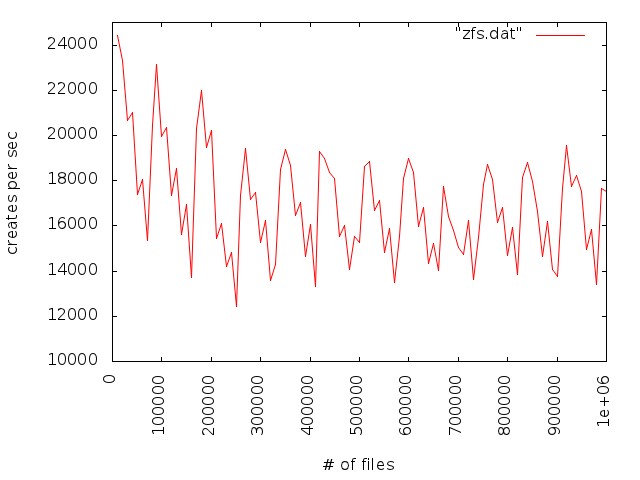
We observe poor file creation rate performance with a zfs backend. The attached jpeg was generated using the createmany benchmark creating 1 million files in a single directory. Files created per second were reported for every 10,000 files created. The green line shows results for Lustre 2.1 and ldiskfs backend. The red line was with ZFS on Orion.
The benchmark was run on the same hardware for both ldisks and ZFS:
MDT: 24 GB RAM, 8 200GB SSD drives in two external SAS-2 enclosures
(Linux MD-RAID10 for ldiskfs, 1 zpool with 8 mirrored pairs for zfs)
OSS: 2 OSS nodes (3 8TB* OSTs each for ldiskfs, 1 72TB OST each for ZFS)
OST: Netapp 60 drive enclosure, 6 24 TB RAID6 LUNs, 3 TB SAS drives, dual 4X QDR IB connections to each OST
Network: 20 Gb/sec 4X DDR IB
*LUNs were partitioned for ldiskfs for compatibility reasons
Attachments
- aplot.eps
- 310 kB
- bplot.eps
- 466 kB
- clients.png
- 11 kB
- creates.jpg
- 64 kB
- mdstats.png
- 7 kB
- mdtest-arcdata.png
- 29 kB
- ori434-run1.tar.bz2
- 62 kB
- osp_object_create.png
- 128 kB
- zfs.jpg
- 45 kB
Issue Links
- duplicates
-
LU-2600 lustre metadata performance is very slow on zfs
-
- Resolved
-
Activity
Here's some additional information about our current workload, in case it's pertinent.
I think with every file written the mtime is changed and permissions are changed by the user's process. In aggregate according to robinhood there are an average of 1 mtime change and about 1.5 permission change operations per file.
Earlier we ran into the issue with synchronous permission changes, because so many are performed - https://jira.hpdd.intel.com/browse/LU-3671 - making them asynchronous helped significantly.
Scott
We were just guessing if we increased the arc size it would delay the performance degradation. We haven't had any OOMs, we have 128GB of RAM.
I don't know if it's really helped, it hasn't hurt. My guess is maybe pointless or a minor help.
Scott
Yea, those numbers look "normal" to me. I'd expect the ARC to be performing reasonably well at that point in time.
I see you're manually tuning a few of the ARC parameters (i.e. arc_meta_limit, c_max, c_min, maybe others?), care to fill me in on why that is? I have a feeling your tuning of arc_meta_limit is helping you, but I'm curious what drove you to do that in the first place and what (if any) perceived benefits you're seeing. Have you been hitting any OOMs with a higher than normal arc_meta_limit? How much RAM is on the system?
Prakesh,
Our user asked us to reset things, so captured the arcstats info and beat down the cache size with that hack.
However, the system wasn't really in an extremely degraded state. The arc was full but I think performance wasn't that bad - lower than his peak, but maybe 50%. Since he's the only user I went ahead and did it anyhow. So I don't know how useful these numbers are for you:
c 4 59624418824 c_min 4 33000000000 c_max 4 96000000000 hdr_size 4 10851742848 data_size 4 25850144256 other_size 4 22922398496 anon_size 4 409600 mru_size 4 7485866496 mru_ghost_size 4 33932813824 mfu_size 4 18363868160 mfu_ghost_size 4 1910375424 l2_size 4 0 l2_hdr_size 4 0 duplicate_buffers_size 4 0 arc_meta_used 4 56346426784 arc_meta_limit 4 66000000000
Reading your previous posts, I think we did see the cache warm-up effect after our restart last time. Performance wasn't great and then got much better as data flowed in over time, then got worse.
Scott
Alex, Does this get you what you want to see?
# zeno1 /root > cat /proc/spl/kstat/zfs/zeno1/reads 8 0 0x01 30 3360 242325718628 766164277255963 UID start objset object level blkid aflags origin pid process 15928 766164156579412 0x2f 178 0 79114 0x64 dbuf_read_impl 3803 ll_ost03_000 15929 766164159823356 0x2f 179 0 84980 0x64 dbuf_read_impl 3803 ll_ost03_000 15930 766164162520769 0x2f 150 0 58855 0x64 dbuf_read_impl 3803 ll_ost03_000 15931 766164163555034 0x2f 169 0 48748 0x64 dbuf_read_impl 6828 ldlm_cn03_007 15932 766164174364152 0x2f 151 0 83592 0x64 dbuf_read_impl 3803 ll_ost03_000 15933 766164177093706 0x2f 148 0 416 0x64 dbuf_read_impl 6828 ldlm_cn03_007 15934 766164184477506 0x2f 152 0 6507 0x64 dbuf_read_impl 3803 ll_ost03_000 15935 766164187822369 0x2f 153 0 24148 0x64 dbuf_read_impl 3803 ll_ost03_000 15936 766164188694642 0x2f 167 0 13795 0x64 dbuf_read_impl 6828 ldlm_cn03_007 15937 766164197669859 0x2f 154 0 36067 0x64 dbuf_read_impl 3803 ll_ost03_000 15938 766164199348418 0x2f 162 0 84625 0x64 dbuf_read_impl 6828 ldlm_cn03_007 15939 766164210502738 0x2f 156 0 63494 0x64 dbuf_read_impl 3803 ll_ost03_000 15940 766164210929591 0x2f 163 0 57995 0x64 dbuf_read_impl 6828 ldlm_cn03_007 15941 766164222820463 0x2f 154 0 10070 0x64 dbuf_read_impl 6828 ldlm_cn03_007 15942 766164222864079 0x2f 157 0 53684 0x64 dbuf_read_impl 3803 ll_ost03_000 15943 766164225929360 0x2f 160 0 34939 0x64 dbuf_read_impl 3803 ll_ost03_000 15944 766164228828963 0x2f 161 0 5729 0x64 dbuf_read_impl 3803 ll_ost03_000 15945 766164231472223 0x2f 162 0 11351 0x64 dbuf_read_impl 3803 ll_ost03_000 15946 766164234109879 0x2f 170 0 59220 0x64 dbuf_read_impl 6828 ldlm_cn03_007 15947 766164237596524 0x2f 163 0 94437 0x64 dbuf_read_impl 3803 ll_ost03_000 15948 766164240488786 0x2f 164 0 57877 0x64 dbuf_read_impl 3803 ll_ost03_000 15949 766164240829980 0x2f 165 0 87378 0x64 dbuf_read_impl 3803 ll_ost03_000 15950 766164243497409 0x2f 166 0 42756 0x64 dbuf_read_impl 3803 ll_ost03_000 15951 766164246480267 0x2f 169 0 48773 0x64 dbuf_read_impl 6828 ldlm_cn03_007 15952 766164249795764 0x2f 167 0 36727 0x64 dbuf_read_impl 3803 ll_ost03_000 15953 766164253590137 0x2f 163 0 66820 0x64 dbuf_read_impl 6828 ldlm_cn03_007 15954 766164261417886 0x2f 168 0 53317 0x64 dbuf_read_impl 3803 ll_ost03_000 15955 766164265303986 0x2f 160 0 8178 0x64 dbuf_read_impl 6828 ldlm_cn03_007 15956 766164272799763 0x2f 171 0 1701 0x64 dbuf_read_impl 6828 ldlm_cn03_007 15957 766164273028298 0x2f 169 0 36867 0x64 dbuf_read_impl 3803 ll_ost03_000
Since the performance you see appears to degrade, and restarting ZFS appears to help things, my guess is you're hitting the same or a very similar we see on our production ZFS filesystems. To double check this, can you run this command on the MDS and post the output (when the system is in the "slow" state):
grep -E "^c|_size|arc_meta_used|arc_meta_limit" /proc/spl/kstat/zfs/arcstats
My guess is the size of the MRU and MFU lists will be very small, while the size of the MRUG and MFUG will be large; but I want to check and make sure.
If we had a way to simply completely reset the arc without restarting the lustre and zfs services, that would be useful.
The very, very ugly hack we have in place at the moment is to drop caches on the MDS once a certain threshold is reached. You can try to run something like this, to see if things go back to the rate you were seeing after a fresh reboot:
for i in `seq 1 10000`; do echo 3 > /proc/sys/vm/drop_caches done
Prakesh,
We can't really do any aggressive testing as this system is in use. However, right now it only has 1 primary user who is populating the file system. Especially once the creates grind down to a trickle, we can have the work halt and do some minor things and restart - naturally they're OK with that as the throughput makes it worthwhile. If there's anything simple we could do or report we will, but probably not patch right now as we're working around the issue.
Regarding, why the patches help lustre's workload – while it's interesting, don't take the effort to write that up on my account.
Just for reference or if it helps in any way, here's what we see and are doing -
We have a system with 1 MDS, 12 OSS. Data is being written to this from existing NFS mounted filesytems (NAS basically). There are I think 6 NAS machines on 1GB or channeled dual 1GB ethernet. These flow through 3 lrouter machines with 10GB ethernet to Infiniband and the servers. We can also test on infiniband connected cluster nodes if needed, but when we see the create problem it of course doesn't matter.
What we saw:
Once our user had everything set and was writing at a reasonable rate, after a week or two file creation went down by a few orders of magnitude, about 2 per second - really bad as noted in this ticket.
On the MDS we noticed txg_sync and arc_adapt particularly busy, but the system cpu mostly idle as also noted above.
To try to at least put the problem off we increased our arc cache settings and restarted, performance was back to normal.
For reference, with mdtest in initial testing we saw around 2000 creates/second. We can't run mdtest right now so we've just been doing simple tests from one node (fdtree is nice by the way), and comparing the same on another zfs backed file system (though not nearly so busy), and a 2.3 ldiskfs based system. This normally gets perhaps 200 to 300 creates per second - all of these file systems are in use, so we can't be too accurate.
After a while performance degraded again, so we stop and restart lustre/zfs on the mds.
I haven't been looking at the OSS's, but just checked and while these do look to have full arc caches, I only see one report in the logs for all servers of slow creates:
Lustre: arcdata-OST001c: Slow creates, 384/512 objects created at a rate of 7/s
So my guess is if these patches help MDS issues more so than OSS, that's at least addressing the more immediate issue for us.
If we had a way to simply completely reset the arc without restarting the lustre and zfs services, that would be useful.
Scott
Alex, I probably could. The test is still running, so I could poke around tomorrow when I get in to the office. I'm also running with the latest ZFS code, so there's a really useful proc file I can use to determine exactly which object(s) it is missing on. Why do you want to know? Understanding the angle you're coming from will help me ensure I gather all the info you need the first time around.
With that said, my guess is it's missing on the precreates. I started the test with an empty filesystem, and at first I saw around 5K creates per second and almost no misses on the MDS or the OSS nodes. After a certain amount of time I began to see a constant ~1% miss rate on the MDS, which actually had a significant affect on the create rate; it brought it down by about 50% to around 2.5K creates per second. After some more time had elapsed, the OSS nodes started to get misses and I began to see the "slow precreate" messages on the OSS node's console. Also, the MDS reads as a whole have become bursty, I see no ARC reads at all on the MDS for seconds at a time. My guess for this is due to the OSS precreates not being able to keep up with the MDS's requests; so while the OSS nodes chug along trying to precreate objects, the MDS sits idle.
I think what's happening now at the tail end of the test, the OSS node's OIs are too large to completely sit in RAM. So when a create happens, it must do a FZAP operation with will hash to a "random" offset into one of the 32 OIs. Since only a portion of the OI can stay resident in RAM, some of these operations will read in a leaf from disk, slowing down the precreate rate and the overall create rate of the test. Once the precreate brings in the leaf, any follow up operations dealing with the same leaf will be a cache hit, until that leaf rolls off the end of the MRU or MFU lists in the ARC.
At least that's my theory based on how I understand all this machinery to work. Unfortunately I haven't gathered any evidence to back this claim up, yet.
Prakash, those ARC misses (on the OSS nodes) .. can you tell whether that happen in the context of object creation or normal read/write/punch ?
Scott, I'm glad you stumbled upon that pull request. My hope is it will get merged very soon (i.e. this week), and will get some more testing from the ZFS community.
Here at LLNL we're still running a 0.6.2 ZFS release in production, although I'm very anxious to get 0.6.3 tagged and put in production because I think it will alleviate a lot of suffering we see on our ZFS servers.
With that said, I'd love to leverage some more testing if you're willing.
With a "small" test cluster (1 MDS, 8 OSS, 14 clients) running https://github.com/zfsonlinux/zfs/pull/2110, I've managed to create over 800 million files in ~8 days at an average rate of about 1.2K creates per second. Without that pull request, the creates per second drop by a couple orders of magnitude within an hour or so. The clients are running a simple fdtree workload (each within a unique directory): "fdtree -d 10 -l 5 -s 1 -f 10000 -C"
If it's useful, I could try and explain why these ZFS patches help Lustre's particular create workload, but it would take a non-trivial amount of effort to write that up and I'm not sure anybody is really interested. And honestly, although both will benefit, that set of patches will probably help the MDS more so than the OSS.
There's definitely more work that needs to be done in this area, though, so I don't want people to think that landing https://github.com/zfsonlinux/zfs/pull/2110 is the end of the road. Specifically, once the OST's OI's become large enough, I'm constantly seeing ARC misses on the OSS nodes. Those are likely due to fzap operations hitting the disk because the OIs are too large to fit in RAM, but I haven't done enough investigation to know for sure.
FYI, the ARC changes landed last Friday to the ZoL master tree. So if you get a chance to update and run with those patches, I'd be interested to know if you still have to "reset" things due to performance degradation.