Details
-
Improvement
-
Resolution: Won't Fix
-
 Blocker
-
None
-
Lustre 2.4.0
-
RHEL 6.2
-
2828
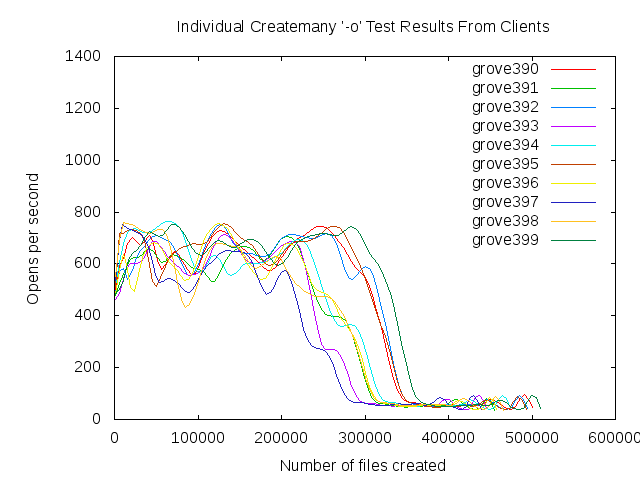
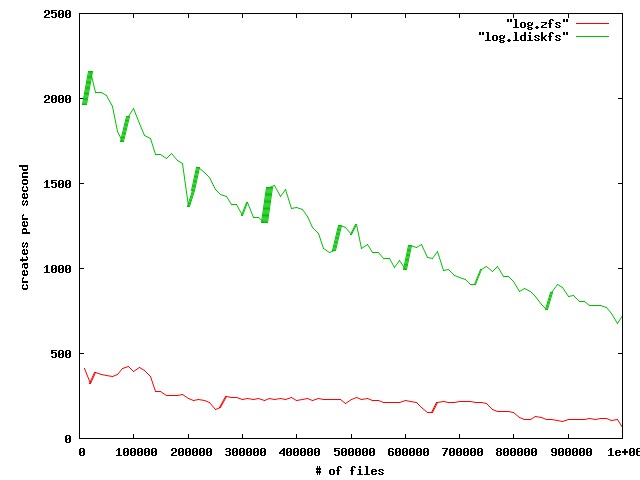
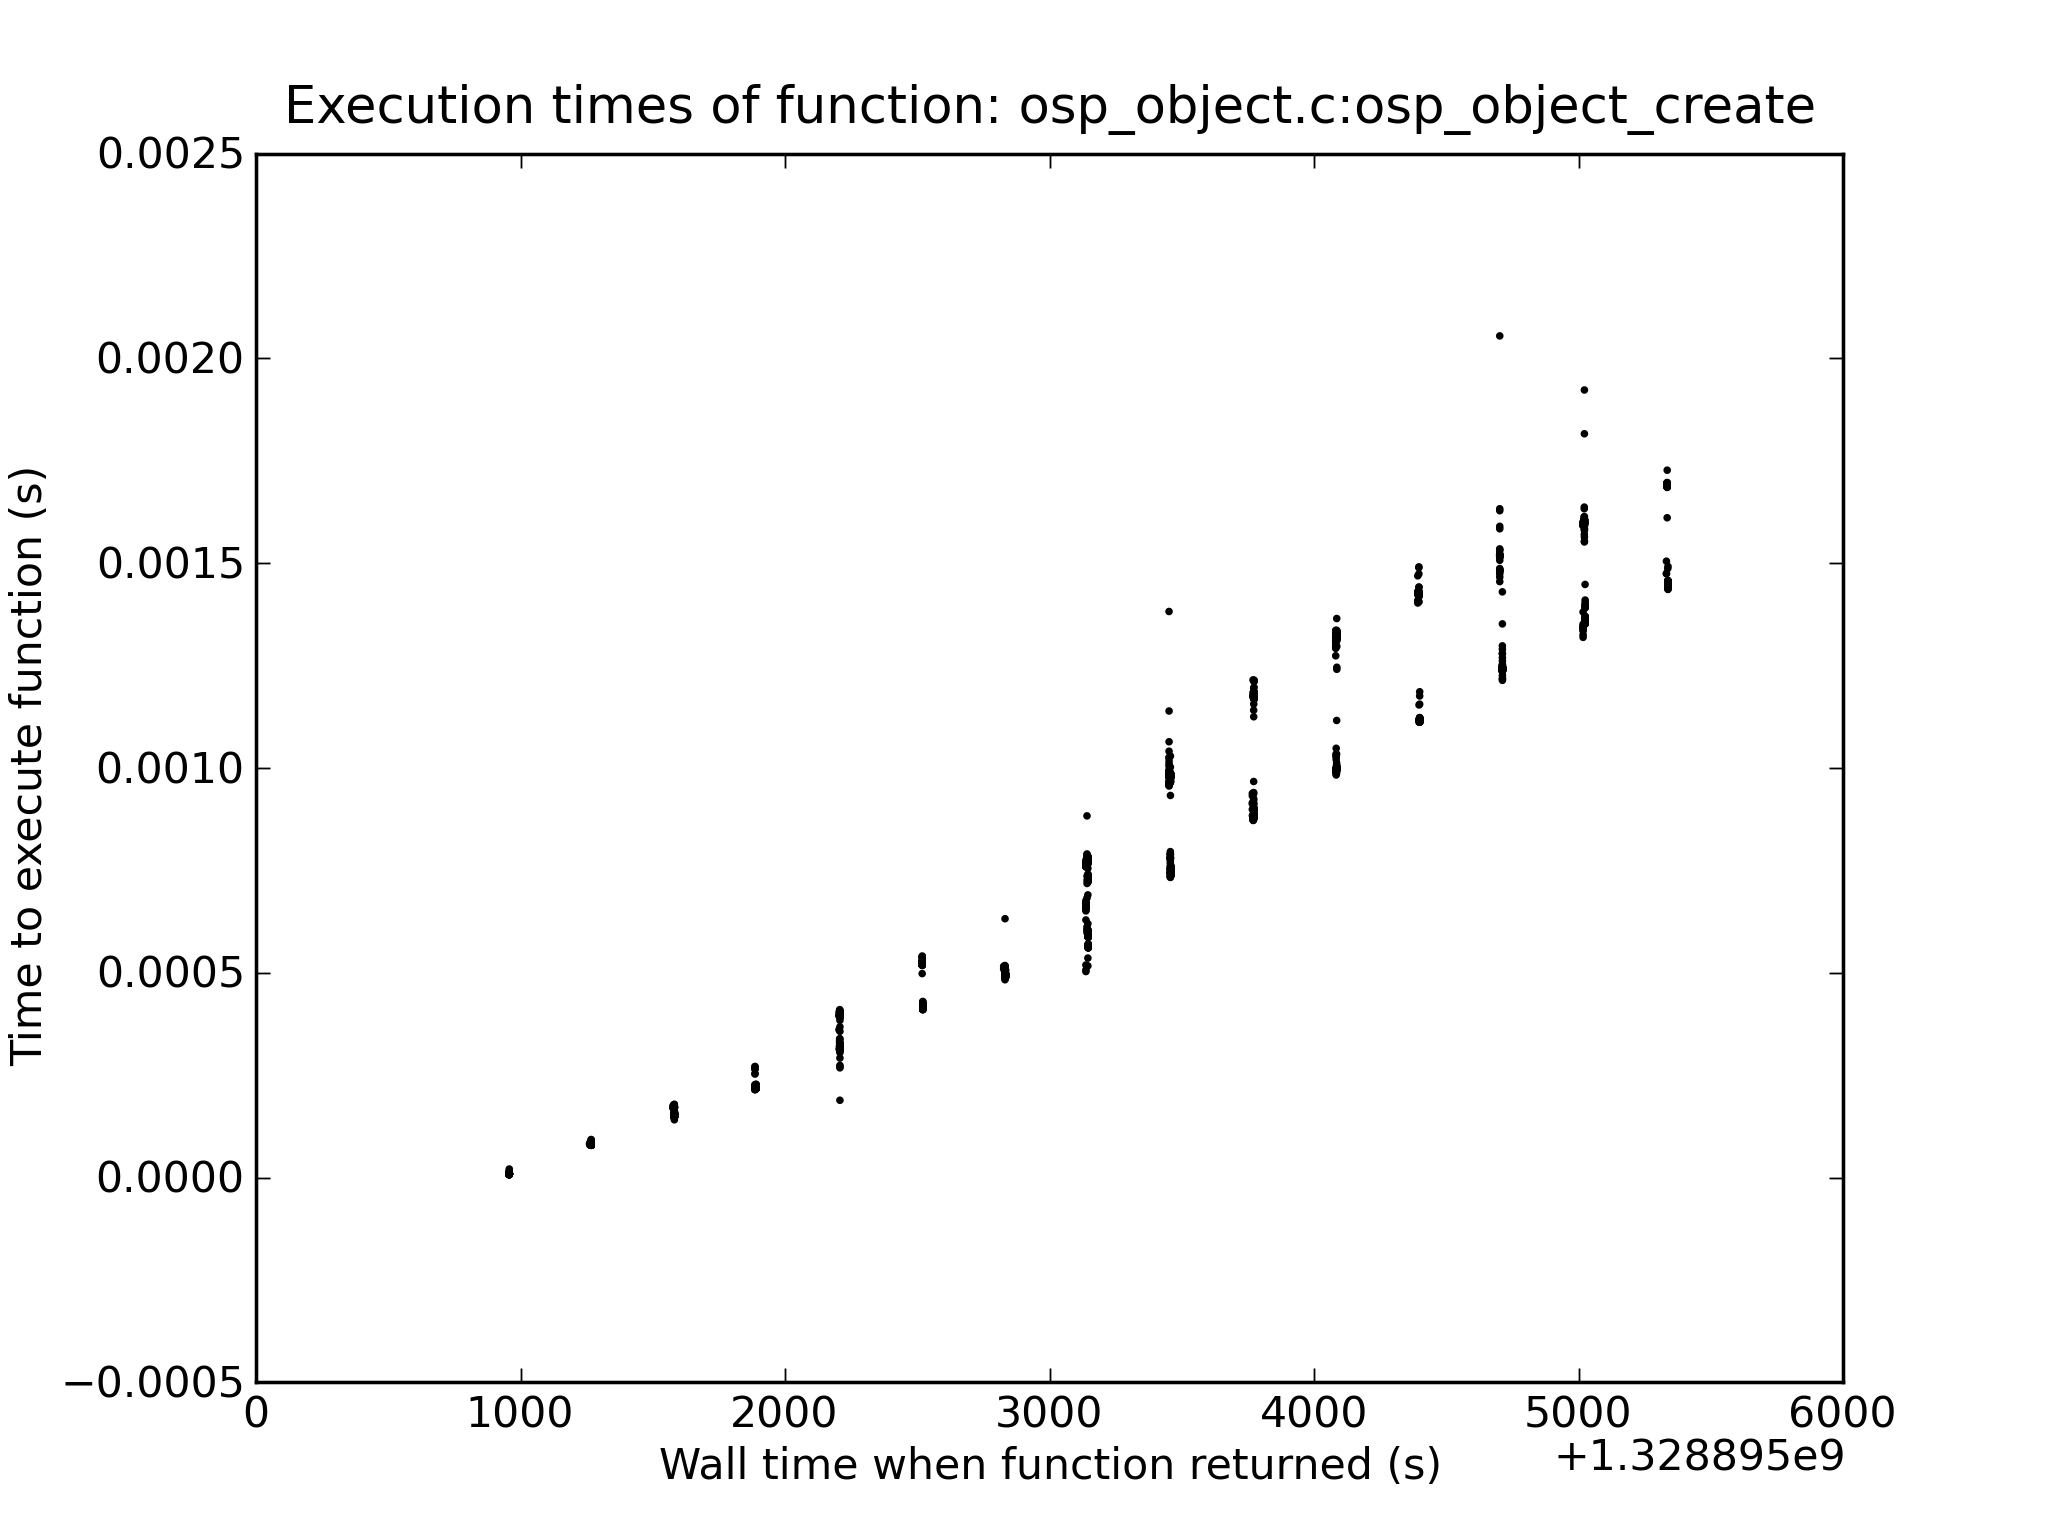
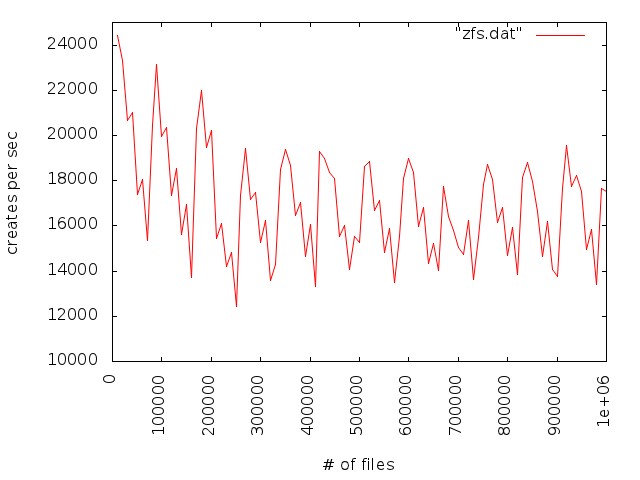
Description
We observe poor file creation rate performance with a zfs backend. The attached jpeg was generated using the createmany benchmark creating 1 million files in a single directory. Files created per second were reported for every 10,000 files created. The green line shows results for Lustre 2.1 and ldiskfs backend. The red line was with ZFS on Orion.
The benchmark was run on the same hardware for both ldisks and ZFS:
MDT: 24 GB RAM, 8 200GB SSD drives in two external SAS-2 enclosures
(Linux MD-RAID10 for ldiskfs, 1 zpool with 8 mirrored pairs for zfs)
OSS: 2 OSS nodes (3 8TB* OSTs each for ldiskfs, 1 72TB OST each for ZFS)
OST: Netapp 60 drive enclosure, 6 24 TB RAID6 LUNs, 3 TB SAS drives, dual 4X QDR IB connections to each OST
Network: 20 Gb/sec 4X DDR IB
*LUNs were partitioned for ldiskfs for compatibility reasons
Attachments
Issue Links
- duplicates
-
LU-2600 lustre metadata performance is very slow on zfs
-

- Resolved
-

Activity
We have upgraded to zfs-0.6.3-1 and while it looks promising that this issue is solved (or greatly improved) I haven't been able to verify this. I managed to run about 20 Million file writes, and need more than 30M to go past the point where things degraded last time.
I'd like to verify it's improved, but can't do it with that system now.
While testing we did unfortunately see decreased numbers for stat, see LU-5212
Scott
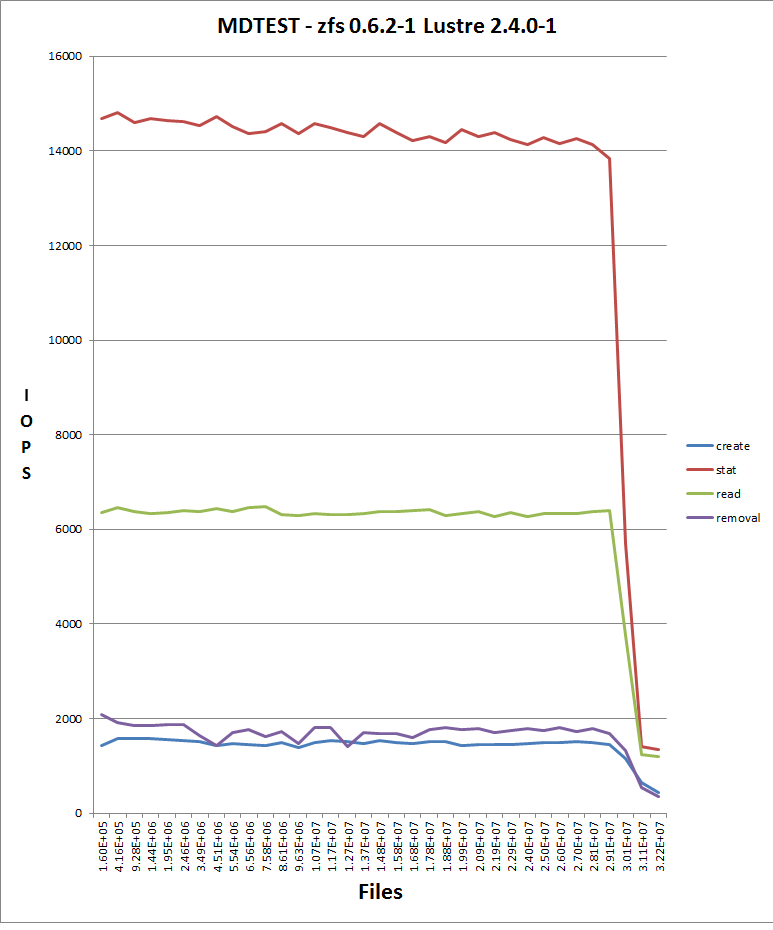
For the record, here is a graph of performance degradation. - mdtest-arcdata.png
After upgrading ram (and to ssd's) we now see it after about 30 million creates.
This is on lustre 2.4.0-1 with zfs 0.6.2, no additional patches
We have 258 G RAM - zfs arc options were doubled from default:
options zfs zfs_arc_meta_limit=10000000000
options zfs zfs_arc_max=150000000000
I know the new version of zfs increases this further by default. Ideally we'd be able to run this test with the new version too.
Interestingly, now I see all other mdtest file operations go bad at about the same time. Previously, with fewer resources and default zfs arc options the file creates tanked very quickly, but the other operations stayed the same. In that case though we never managed to test past maybe a couple million files, as it was so slow.
Just an update on changing the arc parameters. It did take a while to happen, but now we have seen some negative effects. No OOM, but lustre threads taking a long time to complete, indicating overloaded system. So I assume not enough memory for the number of service threads.
Scott
FYI, the ARC changes landed last Friday to the ZoL master tree. So if you get a chance to update and run with those patches, I'd be interested to know if you still have to "reset" things due to performance degradation.
Here's some additional information about our current workload, in case it's pertinent.
I think with every file written the mtime is changed and permissions are changed by the user's process. In aggregate according to robinhood there are an average of 1 mtime change and about 1.5 permission change operations per file.
Earlier we ran into the issue with synchronous permission changes, because so many are performed - https://jira.hpdd.intel.com/browse/LU-3671 - making them asynchronous helped significantly.
Scott
We were just guessing if we increased the arc size it would delay the performance degradation. We haven't had any OOMs, we have 128GB of RAM.
I don't know if it's really helped, it hasn't hurt. My guess is maybe pointless or a minor help.
Scott
Yea, those numbers look "normal" to me. I'd expect the ARC to be performing reasonably well at that point in time.
I see you're manually tuning a few of the ARC parameters (i.e. arc_meta_limit, c_max, c_min, maybe others?), care to fill me in on why that is? I have a feeling your tuning of arc_meta_limit is helping you, but I'm curious what drove you to do that in the first place and what (if any) perceived benefits you're seeing. Have you been hitting any OOMs with a higher than normal arc_meta_limit? How much RAM is on the system?
Old blocker for unsupported version