Details
-
Bug
-
Resolution: Cannot Reproduce
-
 Minor
Minor
-
None
-
Lustre 2.5.2
-
None
-
3
-
15580
Description
This morning some of our clients were hanging (others had not been checked at that time), the active MDS was unresponsive and flooding the console with stack traces. We had to fail over to the second MDS to get the file system back.
Looking at the system logs, we see a large number of these messages:
kernel: socknal_sd00_02: page allocation failure. order:2, mode:0x20 all followed by many stack traces, full log attached. Our monitoring is showing that the memory was mainly used by buffers but this had been the case for all of last week already and was stable and only slowly increasing. After the restart the memory used by buffers has quickly increase to about 60% and currently seems to be stable about there...
Just before these page allocation failure messages we noticed a few client reconnect messages, but have not been able to find any network problems so far. Since the restart of the MDT, no unexpected client reconnects have been seen.
We are running lustre 2.5.2 + 4 patches as recommended in LU-5529 and LU-5514.
We've been hammering the MDS a bit since the upgrade, both creating files, stating many files/directories from many clients etc and removing many files, but I would still expect the MDS not to fall over like this.
Is this a problem/memory leak in Lustre or something else? Could it be related different compile options when compiling Lustre? We did compile the version on the MDS in house with these patches and there is always a chance we didn't quite use the same compile time options that the automatic build process would use...
What can we do to debug this further and avoid it in the future?
Attachments
Issue Links
Activity
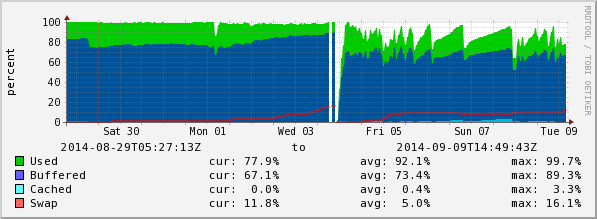
A quick update. Monitoring the memory usage on the MDS over the last week, we've not seen this issue again. See attached memory usage graph, the original issue happened early on Thursday 3, before that buffer memory usage seems to have gone up only, since then the memory/buffer usage has also decreased frequently.
Even though the memory usage wasn't that bad, I took the opportunity of a scheduled maintenance yesterday to collect a debug log just after unmounting the MDT, with malloc added to the debug and debug_mb increased. I've also collected meminfo/slabinfo just before unmounting the MDT, these are attached as well in case there is anything useful in there.
Frederik, it would definitely be useful to see what is in /proc/slabinfo and /proc/meminfo when the MDS is running low on memory. It may be best to just dump this periodically to another system so that it is captured as close to running out of memory as possible if you don't notice this in advance.
In this case we were not able to log into the MDS anymore once we noticed the problem, so couldn't collect these. Equally the serial console was unusable do to the large number of stack traces printed there.
Would it be worth setting the additional debugging and debug log size now and collect the information in /proc/slabinfo and /proc/meminfo just before unmounting during a maintenance window, i.e. before it re-occurs? Then unmount and collect the debug log?
If you run into this case again, please try to log into the MDS and collect /proc/slabinfo and /proc/meminfo to see where all of the memory is allocated.
Ideally, you could also enable the allocation debugging (lctl set_param debug=+alloc), increase the maximum debug log size (lctl set_param debug_mb=200 and then unmount the MDS to see where it is freeing memory, and dump the debug log. Unfortunately this may not capture as much debug logging as one might want because it doesn't have enough memory to store the log itself.
Bobijam
This ticket is perhaps related to the other just assigned to you. Could you please advise
Thanks
Peter
Andreas, All,
the original issue that all/some clients appear to be hanging on most metadata operations is back, this time the memory on the MDS doesn't look bad, so that might have been something else.
The symptoms now that we're taking more time in debugging it appear to be that many clients appear to be hanging for example when doing 'ls -l' on some directories (not the top level directory of the file system). The ls will eventually complete but it takes long enough for users to phone us and a detailed conversation about what they're doing, where, us looking into the machine and it still hasn't completed... This is even for directories with only 2 subdirectories and no files.
The MDS is reporting a number of these messages Lustre: lock timed out (enqueued at 1410413746, 300s ago along with a few threads completing after 200+s, system load is currently around 70, in top there's three processes at the top usually in state 'D': flush-253:6, kcopyd , jbd2/dm-6-8 (see top output below).
It all seems to have started sometime last night with this Sep 11 02:26:13 cs04r-sc-mds03-01 kernel: INFO: task mdt_rdpg00_000:12042 blocked for more than 120 seconds. nothing in the logs after that until 04:00 but it seems to have goten worse after that.
I can't rule out hardware issues on the disk backend but so far have not found any error messages that confirm that.
Syslog from for the relevant time the MDS will be attached, here's an extract. There's nothing Lustre or network related in syslog on the clients or the OSSes.
We don't know what is triggering this, but at the moment we're still running a few jobs both scanning the file systems, copying data away and deleting files in addition to our normal user jobs, so I would expect the MDT to be a bit busier but not that bad.