Details
-
Bug
-
Resolution: Cannot Reproduce
-
 Minor
Minor
-
None
-
Lustre 2.5.2
-
None
-
3
-
15580
Description
This morning some of our clients were hanging (others had not been checked at that time), the active MDS was unresponsive and flooding the console with stack traces. We had to fail over to the second MDS to get the file system back.
Looking at the system logs, we see a large number of these messages:
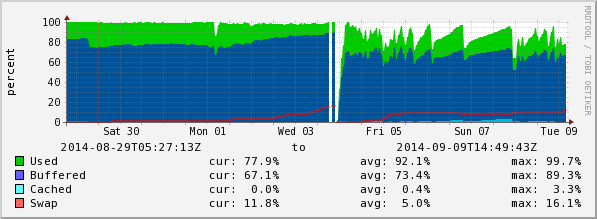
kernel: socknal_sd00_02: page allocation failure. order:2, mode:0x20 all followed by many stack traces, full log attached. Our monitoring is showing that the memory was mainly used by buffers but this had been the case for all of last week already and was stable and only slowly increasing. After the restart the memory used by buffers has quickly increase to about 60% and currently seems to be stable about there...
Just before these page allocation failure messages we noticed a few client reconnect messages, but have not been able to find any network problems so far. Since the restart of the MDT, no unexpected client reconnects have been seen.
We are running lustre 2.5.2 + 4 patches as recommended in LU-5529 and LU-5514.
We've been hammering the MDS a bit since the upgrade, both creating files, stating many files/directories from many clients etc and removing many files, but I would still expect the MDS not to fall over like this.
Is this a problem/memory leak in Lustre or something else? Could it be related different compile options when compiling Lustre? We did compile the version on the MDS in house with these patches and there is always a chance we didn't quite use the same compile time options that the automatic build process would use...
What can we do to debug this further and avoid it in the future?