-
Bug
-
Resolution: Fixed
-
 Major
Major
-
None
-
None
-
3
-
9223372036854775807
Hello,
I've been doing some more benchmark testing for IO500 today and have been reliably hitting what appears to be an LNET/RDMA/Network problem since upgrading our servers and clients to Lustre 2.12.2.
The test environment is:
# 24 Identical servers, each server contains 12x NVMe SSDs.
# Each server is both MDS and OSS
lustre-2.12.2-1.el7.x86_64
kernel-3.10.0-957.10.1.el7_lustre.x86_64

# Fabric is Intel OPA, using distro's in-kernel OFED
# Each server has 2x OPA cards, configured with LNET multi-rail
[root@dac-e-1 ~]# lnetctl net show
net:
    - net type: lo
      local NI(s):
        - nid: 0@lo
          status: up
    - net type: o2ib1
      local NI(s):
        - nid: 10.47.18.1@o2ib1
          status: up
          interfaces:
              0: ib0
        - nid: 10.47.18.25@o2ib1
          status: up
          interfaces:
              0: ib1

# LNET tunables
        tunables:
              peer_timeout: 180
              peer_credits: 128
              peer_buffer_credits: 0
              credits: 1024
              peercredits_hiw: 64
              map_on_demand: 256
              concurrent_sends: 256
              fmr_pool_size: 2048
              fmr_flush_trigger: 512
              fmr_cache: 1
              ntx: 2048
              conns_per_peer: 4
# Test involves 10 clients
lustre-client-2.12.2-1.el7.x86_64
kernel-3.10.0-957.10.1.el7.x86_64

# Client has 1x Intel OPA card
    - net type: o2ib1
      local NI(s):
        - nid: 10.47.20.61@o2ib1
          status: up
          interfaces:
              0: ib0
          statistics:
              send_count: 21957610
              recv_count: 29253267
              drop_count: 2
          tunables:
              peer_timeout: 180
              peer_credits: 128
              peer_buffer_credits: 0
              credits: 1024
              peercredits_hiw: 64
              map_on_demand: 256
              concurrent_sends: 256
              fmr_pool_size: 2048
              fmr_flush_trigger: 512
              fmr_cache: 1
              ntx: 2048
              conns_per_peer: 4
          lnd tunables:
          dev cpt: 0
          tcp bonding: 0
          CPT: "[0,1]"
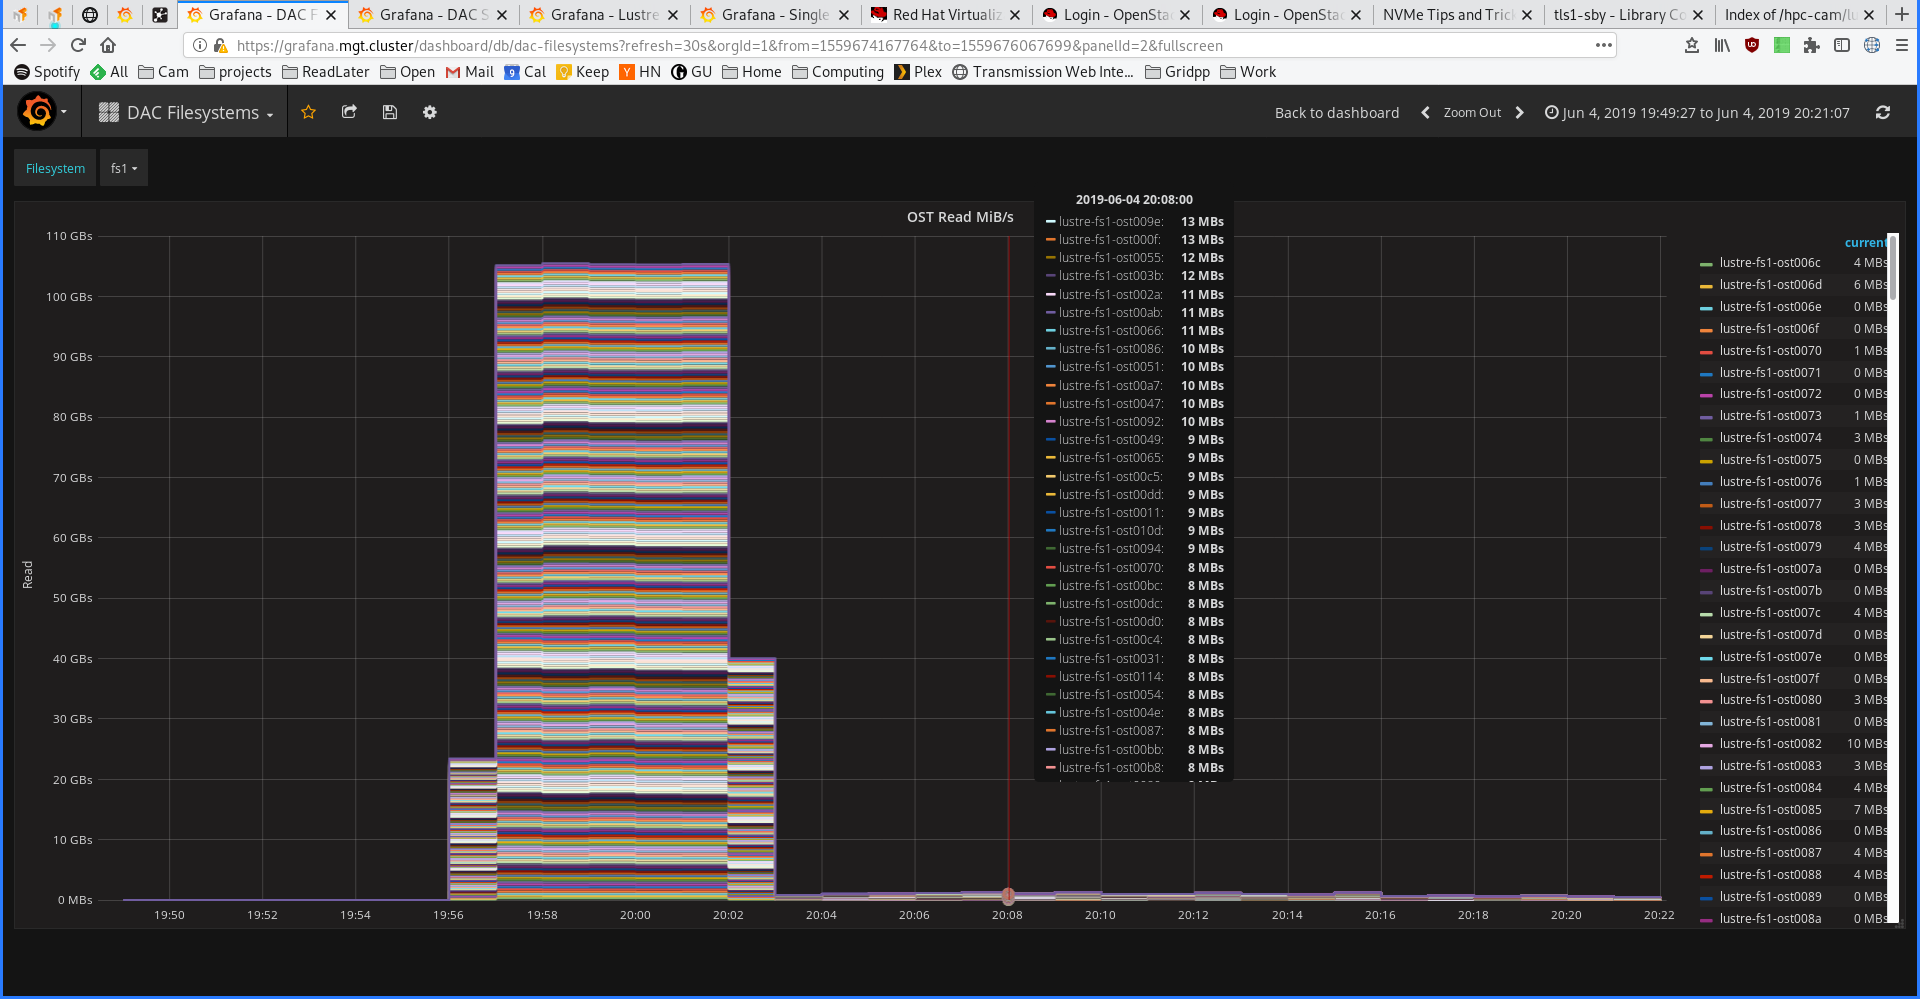
I'm testing with the 'ior_easy' phase of IO500, which just writes a single file per-process to achieve a maximum bandwidth number.
The write phase of the test completes fine, however after a few minutes of the read phase, the clients start to show LNetError messages such as:
Jun 04 19:47:08 cpu-e-1149 kernel: Lustre: Mounted fs1-client
Jun 04 20:01:54 cpu-e-1149 kernel: LNetError: 19644:0:(o2iblnd_cb.c:3335:kiblnd_check_txs_locked()) Timed out tx: tx_queue, 0 seconds
Jun 04 20:01:54 cpu-e-1149 kernel: LNetError: 19644:0:(o2iblnd_cb.c:3335:kiblnd_check_txs_locked()) Skipped 1 previous similar message
Jun 04 20:01:54 cpu-e-1149 kernel: LNetError: 19644:0:(o2iblnd_cb.c:3410:kiblnd_check_conns()) Timed out RDMA with 10.47.18.14@o2ib1 (5): c: 0, oc: 0, rc: 63
Jun 04 20:01:54 cpu-e-1149 kernel: LNetError: 19644:0:(o2iblnd_cb.c:3410:kiblnd_check_conns()) Skipped 1 previous similar message
Jun 04 20:02:04 cpu-e-1149 kernel: Lustre: 19805:0:(client.c:2134:ptlrpc_expire_one_request()) @@@ Request sent has failed due to network error: [sent 1559674918/real 1559674924]  req@ffff8ddc96787500 x1635429905047040/t0(0) o3->fs1-OST0089-osc-ffff8df3bf0c8000@10.47.18.12@o2ib1:6/4 lens 488/440 e 0 to 1 dl 1559674962 ref 2 fl Rpc:eX/0/ffffffff rc 0/-1
Jun 04 20:02:04 cpu-e-1149 kernel: Lustre: 19805:0:(client.c:2134:ptlrpc_expire_one_request()) Skipped 36 previous similar messages
Jun 04 20:02:04 cpu-e-1149 kernel: Lustre: fs1-OST0089-osc-ffff8df3bf0c8000: Connection to fs1-OST0089 (at 10.47.18.12@o2ib1) was lost; in progress operations using this service will wait for recovery to complete
Jun 04 20:02:04 cpu-e-1149 kernel: Lustre: Skipped 4 previous similar messages
Jun 04 20:02:04 cpu-e-1149 kernel: Lustre: fs1-OST0089-osc-ffff8df3bf0c8000: Connection restored to 10.47.18.12@o2ib1 (at 10.47.18.12@o2ib1)
Jun 04 20:02:04 cpu-e-1149 kernel: Lustre: Skipped 4 previous similar messages
Jun 04 20:02:10 cpu-e-1149 kernel: LNet: 34294:0:(o2iblnd.c:941:kiblnd_create_conn()) peer 10.47.18.10@o2ib1 - queue depth reduced from 128 to 63  to allow for qp creation
Jun 04 20:02:10 cpu-e-1149 kernel: LNet: 34294:0:(o2iblnd.c:941:kiblnd_create_conn()) Skipped 83 previous similar messagess
And the servers:
Jun 04 20:02:08 dac-e-10 kernel: Lustre: fs1-OST006f: Client 899ea795-c4b3-f3f8-43dd-db593fc06301 (at 10.47.21.126@o2ib1) reconnecting
Jun 04 20:02:08 dac-e-10 kernel: Lustre: Skipped 1 previous similar message
Jun 04 20:02:59 dac-e-10 kernel: LustreError: 303530:0:(ldlm_lib.c:3268:target_bulk_io()) @@@ truncated bulk READ 0(1048576)  req@ffff8b787babd050 x1635429904859568/t0(0) o3->899ea795-c4b3-f3f8-43dd-db593fc06301@10.47.21.126@o2ib1:527/0 lens 488/440 e 3 to 0 dl 1559674997 ref 1 fl Interpret:/0/0 rc 0/0
Jun 04 20:02:59 dac-e-10 kernel: LustreError: 303530:0:(ldlm_lib.c:3268:target_bulk_io()) Skipped 1 previous similar message
Jun 04 20:02:59 dac-e-10 kernel: Lustre: fs1-OST0074: Bulk IO read error with 899ea795-c4b3-f3f8-43dd-db593fc06301 (at 10.47.21.126@o2ib1), client will retry: rc -110
Jun 04 20:02:59 dac-e-10 kernel: Lustre: Skipped 6 previous similar messages
I've attached log files to the ticket with full logs for all the servers and the clients.
The IOR output with command used is:
IOR-3.3alpha1: MPI Coordinated Test of Parallel I/O
Began               : Tue Jun  4 19:56:12 2019
Command line        : /home/mjr208/projects/benchmarking/io-500-src-stonewall-fix/bin/ior -r -R -a POSIX --posix.odirect -C -t 1m -b 140g -F -i 1 -C -Q 1 -g -G 27 -k -e -o /dac/fs1/mjr208/job12066244-2019-06-04-1950/ior_easy/ior_file_easy -O stoneWallingStatusFile=/dac/fs1/mjr208/job12066244-2019-06-04-1950/ior_easy/stonewall
Machine             : Linux cpu-e-829
TestID              : 0
StartTime           : Tue Jun  4 19:56:12 2019
Path                : /dac/fs1/mjr208/job12066244-2019-06-04-1950/ior_easy
FS                  : 412.6 TiB   Used FS: 8.5%   Inodes: 960.0 Mi   Used Inodes: 0.0%

Options:
api                 : POSIX
apiVersion          :
test filename       : /dac/fs1/mjr208/job12066244-2019-06-04-1950/ior_easy/ior_file_easy
access              : file-per-process
type                : independent
segments            : 1
ordering in a file  : sequential
tasks               : 320
clients per node    : 32
repetitions         : 1
xfersize            : 1 MiB
blocksize           : 140 GiB
aggregate filesize  : 43.75 TiB

Results:

access    bw(MiB/s)  block(KiB) xfer(KiB)  open(s)    wr/rd(s)   close(s)   total(s)   iter
------    ---------  ---------- ---------  --------   --------   --------   --------   ----
WARNING: Expected aggregate file size       = 48103633715200.
WARNING: Stat() of aggregate file size      = 38543976038400.
WARNING: Using actual aggregate bytes moved = 38543976038400.
read      16882      146800640  1024.00    0.023208   2177.30    0.023764   2177.33    0
Max Read:  16882.35 MiB/sec (17702.42 MB/sec)

Summary of all tests:
Operation   Max(MiB)   Min(MiB)  Mean(MiB)     StdDev   Max(OPs)   Min(OPs)  Mean(OPs)     StdDev    Mean(s) Test# #Tasks tPN reps fPP reord reordoff reordrand seed segcnt   blksiz    xsize aggs(MiB)   API RefNum
read        16882.35   16882.35   16882.35       0.00   16882.35   16882.35   16882.35       0.00 2177.32777     0    320  32    1   1     2        1         0    0      1 150323855360  1048576 36758400.0 POSIX      0
Finished            : Tue Jun  4 20:32:29 2019
My main cause for suspicion here is that this same hardware and client combination was running the same benchmark this morning however at that time the servers were running Lustre 2.12.0 and the clients were on 2.10.7.
Is there anything notable in the logs provided as to what might be going on?
Thanks,
Matt
- is related to
-
-
- Resolved
-