-
Bug
-
Resolution: Fixed
-
 Major
Major
-
Lustre 2.13.0
-
None
-
CentOS 7.6, Lustre client 2.13.0 from WC
-
2
-
9223372036854775807
We're not 100% sure this comes from Lustre but this is the main hint that we have so far. We started to upgrade our clients to Lustre 2.13 on Sherlock in mid-December 2019 and it this had taken about 3 weeks to upgrade the whole cluster in a rolling fashion. Now all clients are 2.13. Note that no other changes have been done since then (eg. no system, kernel nor OFED upgrades). Users have been reporting random segmentation faults from all clients. In the few cases that we checked, the binary executed was stored in Lustre, although we're not sure at this point that it's always the case.
Example of segfaults are:
2020-01-14T10:47:50-08:00 sh-116-04 kernel: python[44357]: segfault at a4996 ip 00000000000a4996 sp 00007fc7c945dee8 error 14

2020-01-14T10:46:22-08:00 sh-108-38 kernel: angsd[335614]: segfault at 0 ip           (null) sp 00007ffeec25ab08 error 14

2020-01-14T10:33:27-08:00 sh-107-31 kernel: minimap2[100552]: segfault at 2206 ip 0000000000002206 sp 00007f942ce0cbf8 error 14

2020-01-14T10:33:23-08:00 sh-107-10 kernel: samtools[305687]: segfault at f936 ip 000000000000f936 sp 00007ffebc4dfd18 error 14 in samtools[5631f2a6d000+7000]

2020-01-14T10:32:49-08:00 sh-ln06 kernel: conda[15953]: segfault at 3206 ip 0000000000003206 sp 00007fe3c0495a18 error 14 in python3.7[5590a194e000+5b000]

2020-01-14T10:25:19-08:00 sh-27-30 kernel: gatk[123897]: segfault at 0 ip           (null) sp 00007ffea874efe8 error 14 in python3.8[556487517000+5e000]

2020-01-14T10:25:08-08:00 sh-27-29 kernel: bwa[39718]: segfault at 0 ip           (null) sp 00007f1eebffec08 error 14 in bwa[400000+59000]
Most are error 14. From https://utcc.utoronto.ca/~cks/space/blog/linux/KernelSegfaultErrorCodes:
error 14: attempt to execute code from an unmapped area.
This is the sign of trying to call through a mangled function pointer (or a NULL one), or perhaps returning from a call when the stack is in an unexpected or corrupted state so that the return address isn't valid. One source of mangled function pointers is use-after-free issues where the (freed) object contains embedded function pointers.

(Error 14 with a faulting address of 0 often means a function call through a NULL pointer, which in turn often means 'making an indirect call to a function without checking that it's defined'. There are various larger scale causes of this in code.)
From a core dump of such segfaults, I couldn't get any more insight neither:
$ gdb -c core.118324 /scratch/users/xunger08/run_debug_2018/dqmc_stack
GNU gdb (GDB) Red Hat Enterprise Linux 7.6.1-114.el7
Copyright (C) 2013 Free Software Foundation, Inc.
License GPLv3+: GNU GPL version 3 or later <http://gnu.org/licenses/gpl.html>
This is free software: you are free to change and redistribute it.
There is NO WARRANTY, to the extent permitted by law.  Type "show copying"
and "show warranty" for details.
This GDB was configured as "x86_64-redhat-linux-gnu".
For bug reporting instructions, please see:
<http://www.gnu.org/software/gdb/bugs/>...
Reading symbols from /scratch/users/xunger08/run_debug_2018/dqmc_stack...done.
[New LWP 118364]
[New LWP 118324]
Core was generated by `/scratch/users/xunger08/run_debug_2018/./dqmc_stack -t 35000 /scratch/users/xun'.
Program terminated with signal 11, Segmentation fault.
#0  0x0000000000000000 in ?? ()
(gdb) thread apply all bt

Thread 2 (LWP 118324):
#0  0x00007f393383cf19 in ?? ()
#1  0xcccccccccccccccc in ?? ()
#2  0x00007f3931ceae00 in ?? ()
#3  0x00007f3900000001 in ?? ()
#4  0xcccccccc00000001 in ?? ()
#5  0x00007ffd624a05e0 in ?? ()
#6  0x00007f3900000000 in ?? ()
#7  0x00007f3931ce9d00 in ?? ()
#8  0x00007ffd00000001 in ?? ()
#9  0x00007ffd00000001 in ?? ()
#10 0x00007f3931cea000 in ?? ()
#11 0x0009b4232aa60776 in ?? ()
#12 0x00007ffd00000000 in ?? ()
#13 0x00007f3931cea000 in ?? ()
#14 0x00007ffd00000001 in ?? ()
#15 0x000000005c1b37a8 in ?? ()
#16 0x00007ffd624a09f0 in ?? ()
#17 0x00007ffd00000000 in ?? ()
#18 0x0000000000000001 in ?? ()
#19 0x0000000000000000 in ?? ()

Thread 1 (LWP 118364):
#0  0x0000000000000000 in ?? ()
#1  0x0000000000000000 in ?? ()
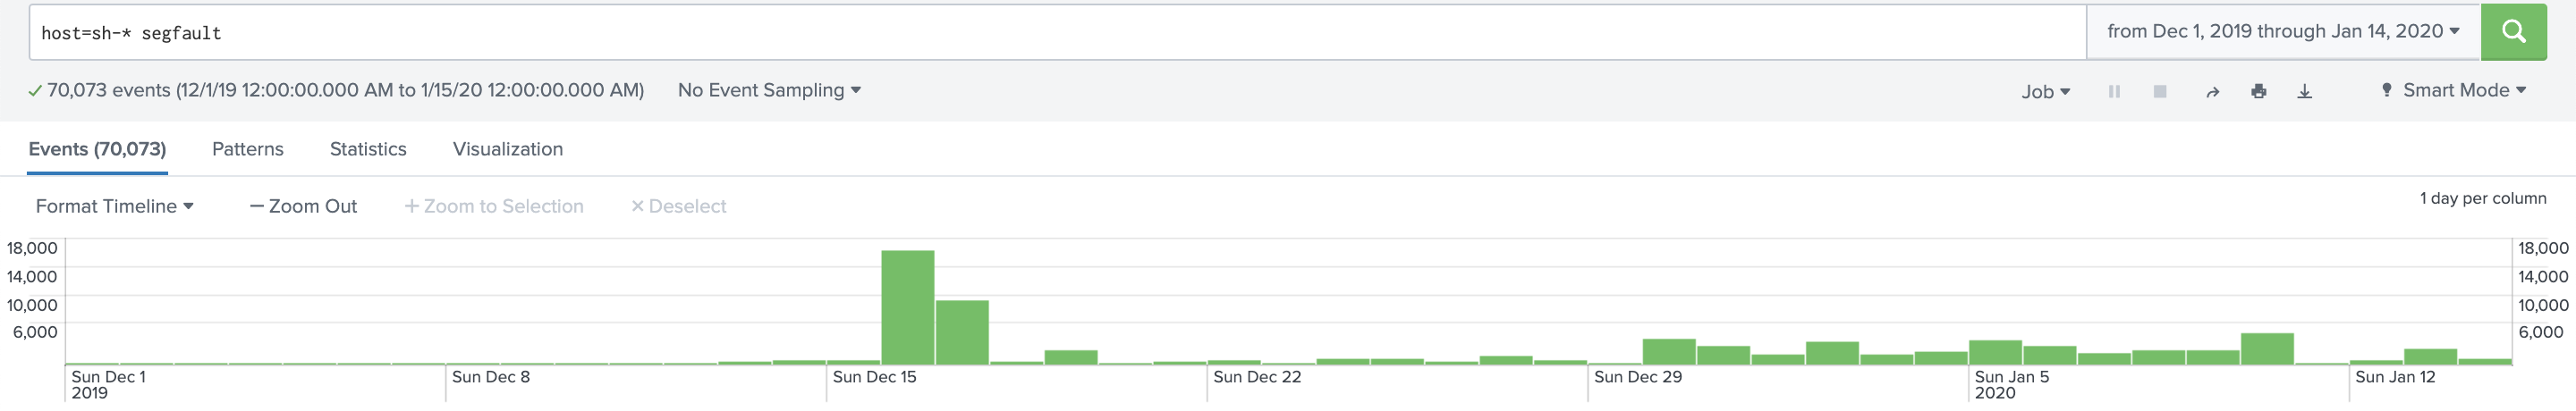
We're strongly wondering if this could be related to this recent 2.12 to 2.13 client upgrade. Checking our logs through Splunk shows that this issue started at the same time we began to upgrade our Lustre clients to 2.13, that is why I'm opening this ticket. Could this be a come-back of an exec-in-lustre issue? Any suggestions are welcomed, otherwise, we'll try to start downgrading to 2.12 LTS and see if that fixes the problem.
Thanks!
- is related to
-
LU-10092 PCC: Lustre Persistent Client Cache
-

- Resolved
-