Uploaded image for project: 'Lustre'
  1. Lustre
  2. LU-3753

MDS operation rate dropping sporadically

Details

    • Bug
    • Resolution: Cannot Reproduce
    • Minor
    • None
    • Lustre 2.4.0
    • None
    • 3
    • 9680

    Description

      Hi,

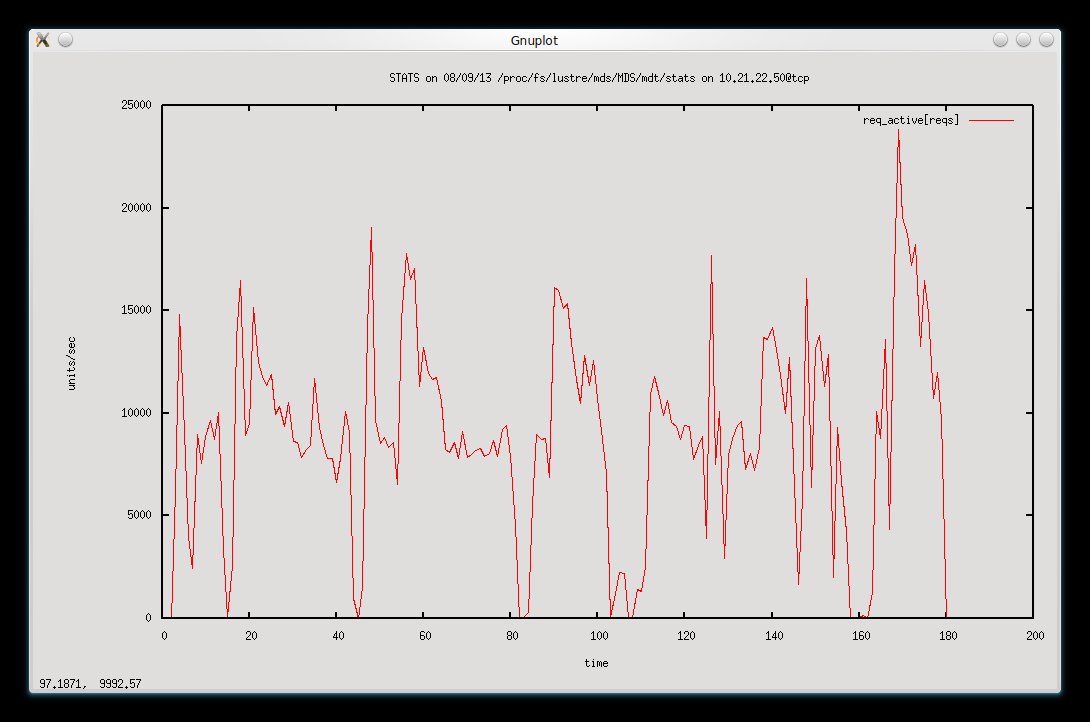
      I have been investigating why our metadata rate keeps dropping to nothing every 30 seconds or so for a few seconds at a time. Looking at the debug logs it looks like it is stuck doing many osp_sync_request_commit_cb() calls. I shouldn't think this should block all other operations so maybe this is not the issue and it's just that these are the only operations that are occurring when we see the rate drop to zero. I'm pretty sure the RAID and storage path is all fine. Here is a snippet illustrating the issue:

      /proc/fs/lustre/mds/MDS/mdt/stats @ 1375970781.677198
      Name Cur.Count Cur.Rate #Events Unit last min avg max stddev
      req_waittime 0 0 803871957 [usec] 0 2 6.63 10477 8.15
      req_qdepth 0 0 803871957 [reqs] 0 0 0.00 12 0.07
      req_active 0 0 803871957 [reqs] 0 1 2.67 16 1.79
      req_timeout 0 0 803871957 [sec] 0 1 15.50 37 14.29
      reqbuf_avail 0 0 1709293570[bufs] 0 47 63.79 64 0.59
      ldlm_ibits_enqueue 0 0 499159709 [reqs] 0 1 1.00 1 0.00
      mds_getattr 0 0 3152776 [usec] 0 8 346.15 1453985 6393.00
      mds_getattr_lock 0 0 158194 [usec] 0 9 83.28 381776 1418.81
      mds_connect 0 0 76 [usec] 0 14 3477.13 147911 21249.32
      mds_disconnect 0 0 19 [usec] 0 26 1178.21 15598 3757.50
      mds_getstatus 0 0 4 [usec] 0 9 13.75 16 3.20
      mds_statfs 0 0 2904 [usec] 0 5 19.87 2115 67.53
      mds_sync 0 0 3 [usec] 0 116 10933.67 32562 18730.69
      mds_getxattr 0 0 50841 [usec] 0 6 12.89 92 3.91
      obd_ping 0 0 530449 [usec] 0 3 11.87 3851 8.76

      00000004:00080000:4.0:1375970781.689383:0:4870:0:(osp_sync.c:317:osp_sync_request_commit_cb()) commit req ffff8821062c4000, transno 8617232460
      00000004:00080000:4.0:1375970781.689384:0:4870:0:(osp_sync.c:317:osp_sync_request_commit_cb()) commit req ffff882d394d4c00, transno 8617232461
      00000004:00080000:4.0:1375970781.689384:0:4870:0:(osp_sync.c:317:osp_sync_request_commit_cb()) commit req ffff883e03485800, transno 8617232462
      00000004:00080000:4.0:1375970781.689385:0:4870:0:(osp_sync.c:317:osp_sync_request_commit_cb()) commit req ffff883479fcdc00, transno 8617232463
      00000004:00080000:4.0:1375970781.689386:0:4870:0:(osp_sync.c:317:osp_sync_request_commit_cb()) commit req ffff883515c1f400, transno 8617232464
      00000004:00080000:4.0:1375970781.689387:0:4870:0:(osp_sync.c:317:osp_sync_request_commit_cb()) commit req ffff883d76783000, transno 8617232465

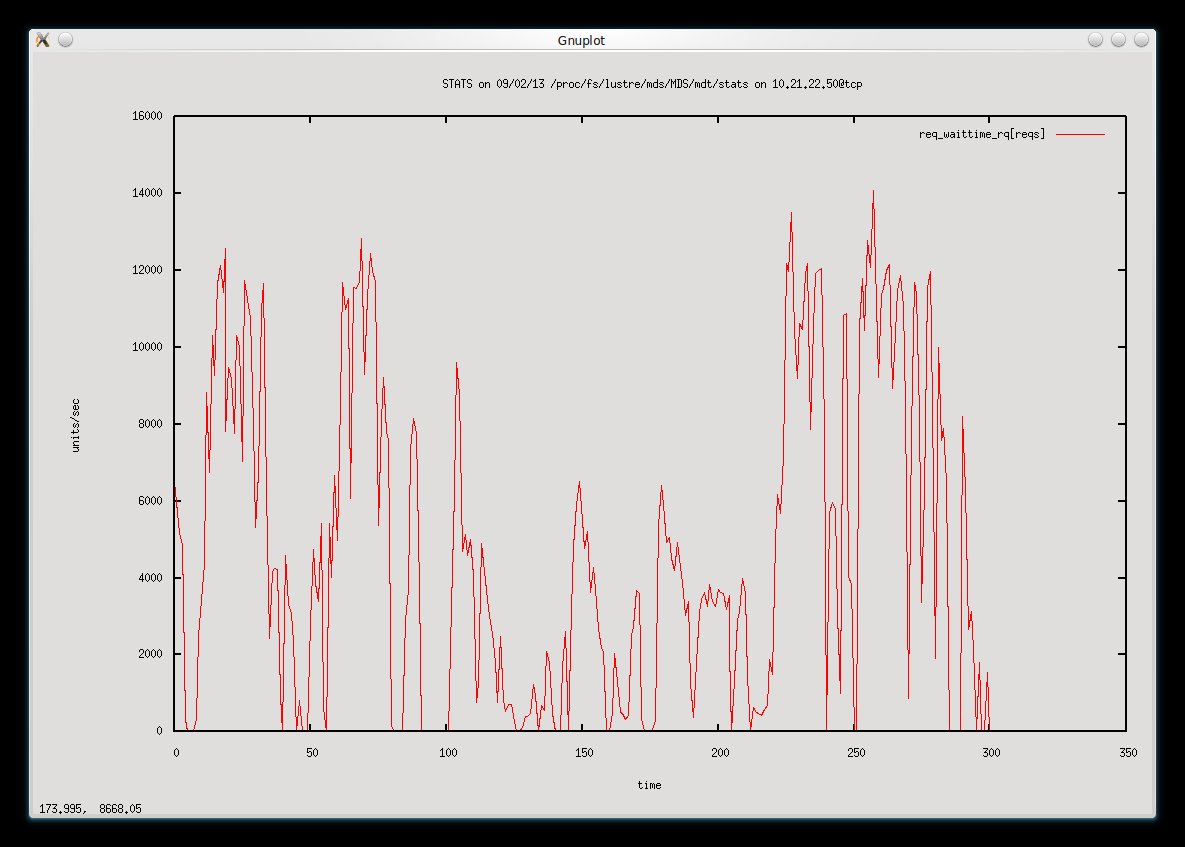
      I am also attaching a graph showing the MDS rate drops over a few minutes. I can upload some full debug logs from the MDS when the rate drops to zero if that helps.

      The workload is running on two clients and copies, hard links and unlinks thousands of directory trees. The two clients suffer performance drops at the same time as the MDS rate drops to zero.

      Cheers,

      Daire

      Attachments

        1. bravo.txt.bz2
          1.35 MB
        2. mds-pauses.jpeg
          mds-pauses.jpeg
          76 kB
        3. mds-pauses2.jpeg
          mds-pauses2.jpeg
          97 kB

        Issue Links

          Activity

            [LU-3753] MDS operation rate dropping sporadically
            pjones Peter Jones added a comment -

            ok thanks Daire

            pjones Peter Jones added a comment - ok thanks Daire

            You can definitely close this now. For our workloads SSD based MDTs is required and is now working well for us.

            Cheers,

            daire Daire Byrne (Inactive) added a comment - You can definitely close this now. For our workloads SSD based MDTs is required and is now working well for us. Cheers,

            Hi,

            I just wanted to update this ticket with recent changes to our config. We have now replaced the 10K SAS drives in our external DELL RAID with SSDs (RAID0 with 2xRAID5 9disks). With our extremely heavy link/unlink workload we are seeing much better peak IOP performance. The journal is internal in this case.

            req_waittime              20878      20878      21619361  [usec]       150732          2         7.37     176237     70.37 
            req_waittime              21540      21540      21640901  [usec]       160872          2         7.37     176237     70.33 
            req_waittime              18086      18086      21658987  [usec]       128436          2         7.37     176237     70.30 
            req_waittime              20076      20076      21679063  [usec]       143419          2         7.37     176237     70.27 
            req_waittime              20525      20525      21699588  [usec]       144492          2         7.37     176237     70.24 
            req_waittime              15152      15152      21714740  [usec]       108671          2         7.37     176237     70.21 
            req_waittime              12877      12877      21727617  [usec]        94028          2         7.37     176237     70.19 
            req_waittime              18741      18741      21746358  [usec]       136609          2         7.37     176237     70.16 
            req_waittime              20261      20261      21766619  [usec]       145094          2         7.37     176237     70.13 
            req_waittime              10070      10070      21776689  [usec]        73515          2         7.37     176237     70.11 
            req_waittime              6038       6038       21782727  [usec]        51293          2         7.37     176237     70.10 
            req_waittime              22204      22204      21804931  [usec]       155824          2         7.37     176237     70.07 
            req_waittime              21095      21095      21826026  [usec]       153739          2         7.37     176237     70.03 
            req_waittime              15435      15435      21841461  [usec]       111966          2         7.37     176237     70.01 
            req_waittime              20672      20672      21862133  [usec]       147581          2         7.37     176237     69.98 
            req_waittime              22573      22573      21884706  [usec]       160090          2         7.37     176237     69.94 
            req_waittime              13807      13807      21898513  [usec]        98643          2         7.37     176237     69.92 
            req_waittime              20257      20257      21918770  [usec]       144935          2         7.37     176237     69.89 
            req_waittime              20398      20398      21939168  [usec]       144100          2         7.37     176237     69.85 
            req_waittime              20208      20208      21959376  [usec]       143570          2         7.37     176237     69.82 
            req_waittime              6276       6276       21965652  [usec]        44278          2         7.37     176237     69.81 
            req_waittime              3850       3850       21969502  [usec]        28082          2         7.37     176237     69.81 
            req_waittime              12482      12482      21981984  [usec]        90562          2         7.37     176237     69.79
            ..
            

            However I am now seeing that the issue whereby the IOPs drops to zero at regular intervals is now returning after many hours of operation. This halves the average IOPs so has a fairly big effect on performance. Once I remount the MDT the performance returns to normal/maximum again for X hours. It's almost like the performance drops off once the server memory/cache fills up (256Gigs).

            req_waittime              4889       4889       1102506250[usec]        35266          2         8.02    2613228    507.60 
            req_waittime              10978      10978      1102517228[usec]        85139          2         8.02    2613228    507.60 
            req_waittime              9717       9717       1102526945[usec]        73508          2         8.02    2613228    507.59 
            req_waittime              13839      13839      1102540784[usec]       102205          2         8.02    2613228    507.59 
            req_waittime              13343      13343      1102554127[usec]        98177          2         8.02    2613228    507.59 
            req_waittime              10959      10959      1102565086[usec]        83997          2         8.02    2613228    507.58 
            req_waittime              8660       8660       1102573746[usec]        63587          2         8.02    2613228    507.58 
            req_waittime              1307       1307       1102575053[usec]         8431          2         8.02    2613228    507.58 
            req_waittime              0          0          1102575053[usec]            0          2         8.02    2613228    507.58 
            req_waittime              1169       1169       1102576222[usec]         7085          2         8.02    2613228    507.58 
            req_waittime              3012       3012       1102579234[usec]        20816          2         8.02    2613228    507.58 
            req_waittime              12367      12367      1102591601[usec]        92169          2         8.02    2613228    507.58 
            req_waittime              13004      13004      1102604605[usec]        99554          2         8.02    2613228    507.58 
            req_waittime              13152      13152      1102617757[usec]        99387          2         8.02    2613228    507.57 
            req_waittime              12478      12478      1102630235[usec]        94129          2         8.02    2613228    507.57 
            req_waittime              15342      15342      1102645577[usec]       111265          2         8.02    2613228    507.57 
            req_waittime              6443       6443       1102652020[usec]        47035          2         8.02    2613228    507.56 
            req_waittime              983        983        1102653003[usec]         6440          2         8.02    2613228    507.56 
            req_waittime              0          0          1102653003[usec]            0          2         8.02    2613228    507.56 
            req_waittime              1068       1068       1102654071[usec]         6716          2         8.02    2613228    507.56 
            req_waittime              3278       3278       1102657349[usec]        24421          2         8.02    2613228    507.56 
            req_waittime              13877      13877      1102671226[usec]       103323          2         8.02    2613228    507.56 
            req_waittime              12384      12384      1102683610[usec]        92282          2         8.02    2613228    507.56 
            req_waittime              13866      13866      1102697476[usec]        98032          2         8.01    2613228    507.55 
            req_waittime              12153      12153      1102709629[usec]        86540          2         8.01    2613228    507.55 
            req_waittime              10753      10753      1102720382[usec]        79395          2         8.01    2613228    507.55 
            req_waittime              4344       4344       1102724726[usec]        36456          2         8.01    2613228    507.55 
            req_waittime              70         70         1102724796[usec]          443          2         8.01    2613228    507.55 
            req_waittime              0          0          1102724796[usec]            0          2         8.01    2613228    507.55 
            req_waittime              191        191        1102724987[usec]         1507          2         8.01    2613228    507.55 
            req_waittime              5686       5686       1102730673[usec]        38777          2         8.01    2613228    507.55 
            req_waittime              11976      11976      1102742649[usec]        91311          2         8.01    2613228    507.54 
            req_waittime              12811      12811      1102755460[usec]        92589          2         8.01    2613228    507.54 
            req_waittime              12153      12153      1102767613[usec]        89900          2         8.01    2613228    507.54 
            req_waittime              11515      11515      1102779128[usec]        87047          2         8.01    2613228    507.54 
            req_waittime              11057      11057      1102790185[usec]        82195          2         8.01    2613228    507.53 
            req_waittime              5531       5531       1102795716[usec]        39728          2         8.01    2613228    507.53 
            req_waittime              20         20         1102795736[usec]          167          2         8.01    2613228    507.53
            ..
            
            # cat /proc/fs/jbd2/md0-8/info
            594841 transaction, each up to 25600 blocks
            average: 
              0ms waiting for transaction
              2ms running transaction
              0ms transaction was being locked
              0ms flushing data (in ordered mode)
              1ms logging transaction
              183570us average transaction commit time
              10 handles per transaction
              31 blocks per transaction
              32 logged blocks per transaction
            
            # dumpe2fs -h /dev/md0
            dumpe2fs 1.42.7.wc1 (12-Apr-2013)
            Filesystem volume name:   bravo-MDT0000
            Last mounted on:          /
            Filesystem UUID:          468d314b-55f5-4d52-99ab-ab4baa527c73
            Filesystem magic number:  0xEF53
            Filesystem revision #:    1 (dynamic)
            Filesystem features:      has_journal ext_attr resize_inode dir_index filetype needs_recovery flex_bg dirdata sparse_super large_file huge_file uninit_bg dir_nlink quota
            Filesystem flags:         signed_directory_hash 
            Default mount options:    user_xattr acl
            Filesystem state:         clean
            Errors behavior:          Continue
            Filesystem OS type:       Linux
            Inode count:              3121512448
            Block count:              1560747776
            Reserved block count:     78037388
            Free blocks:              726316155
            Free inodes:              2690673937
            First block:              0
            Block size:               4096
            Fragment size:            4096
            Reserved GDT blocks:      1024
            Blocks per group:         16384
            Fragments per group:      16384
            Inodes per group:         32768
            Inode blocks per group:   4096
            RAID stride:              128
            RAID stripe width:        256
            Flex block group size:    16
            Filesystem created:       Wed Dec 11 12:35:07 2013
            Last mount time:          Thu Jan  9 11:14:43 2014
            Last write time:          Thu Jan  9 11:14:43 2014
            Mount count:              12
            Maximum mount count:      -1
            Last checked:             Wed Dec 11 12:35:07 2013
            Check interval:           0 (<none>)
            Lifetime writes:          72 TB
            Reserved blocks uid:      0 (user root)
            Reserved blocks gid:      0 (group root)
            First inode:              11
            Inode size:               512
            Required extra isize:     28
            Desired extra isize:      28
            Journal inode:            8
            Default directory hash:   half_md4
            Directory Hash Seed:      b3732abb-0697-4314-bec1-104d3524a83f
            Journal backup:           inode blocks
            User quota inode:         3
            Group quota inode:        4
            Journal features:         journal_incompat_revoke
            Journal size:             400M
            Journal length:           102400
            Journal sequence:         0x00136afd
            Journal start:            86536
            
            daire Daire Byrne (Inactive) added a comment - Hi, I just wanted to update this ticket with recent changes to our config. We have now replaced the 10K SAS drives in our external DELL RAID with SSDs (RAID0 with 2xRAID5 9disks). With our extremely heavy link/unlink workload we are seeing much better peak IOP performance. The journal is internal in this case. req_waittime 20878 20878 21619361 [usec] 150732 2 7.37 176237 70.37 req_waittime 21540 21540 21640901 [usec] 160872 2 7.37 176237 70.33 req_waittime 18086 18086 21658987 [usec] 128436 2 7.37 176237 70.30 req_waittime 20076 20076 21679063 [usec] 143419 2 7.37 176237 70.27 req_waittime 20525 20525 21699588 [usec] 144492 2 7.37 176237 70.24 req_waittime 15152 15152 21714740 [usec] 108671 2 7.37 176237 70.21 req_waittime 12877 12877 21727617 [usec] 94028 2 7.37 176237 70.19 req_waittime 18741 18741 21746358 [usec] 136609 2 7.37 176237 70.16 req_waittime 20261 20261 21766619 [usec] 145094 2 7.37 176237 70.13 req_waittime 10070 10070 21776689 [usec] 73515 2 7.37 176237 70.11 req_waittime 6038 6038 21782727 [usec] 51293 2 7.37 176237 70.10 req_waittime 22204 22204 21804931 [usec] 155824 2 7.37 176237 70.07 req_waittime 21095 21095 21826026 [usec] 153739 2 7.37 176237 70.03 req_waittime 15435 15435 21841461 [usec] 111966 2 7.37 176237 70.01 req_waittime 20672 20672 21862133 [usec] 147581 2 7.37 176237 69.98 req_waittime 22573 22573 21884706 [usec] 160090 2 7.37 176237 69.94 req_waittime 13807 13807 21898513 [usec] 98643 2 7.37 176237 69.92 req_waittime 20257 20257 21918770 [usec] 144935 2 7.37 176237 69.89 req_waittime 20398 20398 21939168 [usec] 144100 2 7.37 176237 69.85 req_waittime 20208 20208 21959376 [usec] 143570 2 7.37 176237 69.82 req_waittime 6276 6276 21965652 [usec] 44278 2 7.37 176237 69.81 req_waittime 3850 3850 21969502 [usec] 28082 2 7.37 176237 69.81 req_waittime 12482 12482 21981984 [usec] 90562 2 7.37 176237 69.79 .. However I am now seeing that the issue whereby the IOPs drops to zero at regular intervals is now returning after many hours of operation. This halves the average IOPs so has a fairly big effect on performance. Once I remount the MDT the performance returns to normal/maximum again for X hours. It's almost like the performance drops off once the server memory/cache fills up (256Gigs). req_waittime 4889 4889 1102506250[usec] 35266 2 8.02 2613228 507.60 req_waittime 10978 10978 1102517228[usec] 85139 2 8.02 2613228 507.60 req_waittime 9717 9717 1102526945[usec] 73508 2 8.02 2613228 507.59 req_waittime 13839 13839 1102540784[usec] 102205 2 8.02 2613228 507.59 req_waittime 13343 13343 1102554127[usec] 98177 2 8.02 2613228 507.59 req_waittime 10959 10959 1102565086[usec] 83997 2 8.02 2613228 507.58 req_waittime 8660 8660 1102573746[usec] 63587 2 8.02 2613228 507.58 req_waittime 1307 1307 1102575053[usec] 8431 2 8.02 2613228 507.58 req_waittime 0 0 1102575053[usec] 0 2 8.02 2613228 507.58 req_waittime 1169 1169 1102576222[usec] 7085 2 8.02 2613228 507.58 req_waittime 3012 3012 1102579234[usec] 20816 2 8.02 2613228 507.58 req_waittime 12367 12367 1102591601[usec] 92169 2 8.02 2613228 507.58 req_waittime 13004 13004 1102604605[usec] 99554 2 8.02 2613228 507.58 req_waittime 13152 13152 1102617757[usec] 99387 2 8.02 2613228 507.57 req_waittime 12478 12478 1102630235[usec] 94129 2 8.02 2613228 507.57 req_waittime 15342 15342 1102645577[usec] 111265 2 8.02 2613228 507.57 req_waittime 6443 6443 1102652020[usec] 47035 2 8.02 2613228 507.56 req_waittime 983 983 1102653003[usec] 6440 2 8.02 2613228 507.56 req_waittime 0 0 1102653003[usec] 0 2 8.02 2613228 507.56 req_waittime 1068 1068 1102654071[usec] 6716 2 8.02 2613228 507.56 req_waittime 3278 3278 1102657349[usec] 24421 2 8.02 2613228 507.56 req_waittime 13877 13877 1102671226[usec] 103323 2 8.02 2613228 507.56 req_waittime 12384 12384 1102683610[usec] 92282 2 8.02 2613228 507.56 req_waittime 13866 13866 1102697476[usec] 98032 2 8.01 2613228 507.55 req_waittime 12153 12153 1102709629[usec] 86540 2 8.01 2613228 507.55 req_waittime 10753 10753 1102720382[usec] 79395 2 8.01 2613228 507.55 req_waittime 4344 4344 1102724726[usec] 36456 2 8.01 2613228 507.55 req_waittime 70 70 1102724796[usec] 443 2 8.01 2613228 507.55 req_waittime 0 0 1102724796[usec] 0 2 8.01 2613228 507.55 req_waittime 191 191 1102724987[usec] 1507 2 8.01 2613228 507.55 req_waittime 5686 5686 1102730673[usec] 38777 2 8.01 2613228 507.55 req_waittime 11976 11976 1102742649[usec] 91311 2 8.01 2613228 507.54 req_waittime 12811 12811 1102755460[usec] 92589 2 8.01 2613228 507.54 req_waittime 12153 12153 1102767613[usec] 89900 2 8.01 2613228 507.54 req_waittime 11515 11515 1102779128[usec] 87047 2 8.01 2613228 507.54 req_waittime 11057 11057 1102790185[usec] 82195 2 8.01 2613228 507.53 req_waittime 5531 5531 1102795716[usec] 39728 2 8.01 2613228 507.53 req_waittime 20 20 1102795736[usec] 167 2 8.01 2613228 507.53 .. # cat /proc/fs/jbd2/md0-8/info 594841 transaction, each up to 25600 blocks average: 0ms waiting for transaction 2ms running transaction 0ms transaction was being locked 0ms flushing data (in ordered mode) 1ms logging transaction 183570us average transaction commit time 10 handles per transaction 31 blocks per transaction 32 logged blocks per transaction # dumpe2fs -h /dev/md0 dumpe2fs 1.42.7.wc1 (12-Apr-2013) Filesystem volume name: bravo-MDT0000 Last mounted on: / Filesystem UUID: 468d314b-55f5-4d52-99ab-ab4baa527c73 Filesystem magic number: 0xEF53 Filesystem revision #: 1 (dynamic) Filesystem features: has_journal ext_attr resize_inode dir_index filetype needs_recovery flex_bg dirdata sparse_super large_file huge_file uninit_bg dir_nlink quota Filesystem flags: signed_directory_hash Default mount options: user_xattr acl Filesystem state: clean Errors behavior: Continue Filesystem OS type: Linux Inode count: 3121512448 Block count: 1560747776 Reserved block count: 78037388 Free blocks: 726316155 Free inodes: 2690673937 First block: 0 Block size: 4096 Fragment size: 4096 Reserved GDT blocks: 1024 Blocks per group: 16384 Fragments per group: 16384 Inodes per group: 32768 Inode blocks per group: 4096 RAID stride: 128 RAID stripe width: 256 Flex block group size: 16 Filesystem created: Wed Dec 11 12:35:07 2013 Last mount time: Thu Jan 9 11:14:43 2014 Last write time: Thu Jan 9 11:14:43 2014 Mount count: 12 Maximum mount count: -1 Last checked: Wed Dec 11 12:35:07 2013 Check interval: 0 (<none>) Lifetime writes: 72 TB Reserved blocks uid: 0 (user root) Reserved blocks gid: 0 (group root) First inode: 11 Inode size: 512 Required extra isize: 28 Desired extra isize: 28 Journal inode: 8 Default directory hash: half_md4 Directory Hash Seed: b3732abb-0697-4314-bec1-104d3524a83f Journal backup: inode blocks User quota inode: 3 Group quota inode: 4 Journal features: journal_incompat_revoke Journal size: 400M Journal length: 102400 Journal sequence: 0x00136afd Journal start: 86536

            Well since putting the external journal in place the performance of this workload has almost doubled. Responsiveness of the filesystem has also noticeably improved. We may put off downgrading to v1.8 for a while longer while we further test v2.4 for other potential issues. Thanks for your help again.

            daire Daire Byrne (Inactive) added a comment - Well since putting the external journal in place the performance of this workload has almost doubled. Responsiveness of the filesystem has also noticeably improved. We may put off downgrading to v1.8 for a while longer while we further test v2.4 for other potential issues. Thanks for your help again.

            this might be due to journal overflow, which happens sometimes and it takes a bit to free the journal. if the theory is correct, then the similar (probably with less frequency) behavior should be observed with 1.8

            bzzz Alex Zhuravlev added a comment - this might be due to journal overflow, which happens sometimes and it takes a bit to free the journal. if the theory is correct, then the similar (probably with less frequency) behavior should be observed with 1.8

            Seeing the drop to zero transactions a lot less frequently now and they never last more than a couple of seconds. Maybe every 30+ mins instead of every couple of mins... Certainly a lot better than it was. The overall throughput graphs are showing a noticeable increase too. Here's and example of a stall that happened just now:

            req_waittime              10357      10357      57808929  [usec]        70735          2         6.59       9887      4.80 
            req_waittime              11138      11138      57820067  [usec]        74281          2         6.59       9887      4.80 
            req_waittime              13940      13940      57834007  [usec]        97575          2         6.59       9887      4.80 
            req_waittime              11907      11907      57845914  [usec]        82263          2         6.59       9887      4.80 
            req_waittime              11521      11521      57857435  [usec]        79703          2         6.59       9887      4.80 
            req_waittime              2642       2642       57860077  [usec]        17844          2         6.59       9887      4.80 
            req_waittime              5          5          57860082  [usec]          128          2         6.59       9887      4.80 
            req_waittime              1          1          57860083  [usec]           32          2         6.59       9887      4.80 
            req_waittime              2          2          57860085  [usec]           43          2         6.59       9887      4.80 
            req_waittime              0          0          57860085  [usec]            0          2         6.59       9887      4.80 
            req_waittime              902        902        57860987  [usec]         6832          2         6.59       9887      4.80 
            req_waittime              11040      11040      57872027  [usec]        73828          2         6.59       9887      4.80 
            req_waittime              8804       8804       57880831  [usec]        61287          2         6.59       9887      4.80 
            req_waittime              9867       9867       57890698  [usec]        66307          2         6.59       9887      4.79 
            req_waittime              11310      11310      57902008  [usec]        75206          2         6.59       9887      4.79 
            req_waittime              11138      11138      57913146  [usec]        74315          2         6.59       9887      4.79 
            req_waittime              9425       9425       57922571  [usec]        61696          2         6.59       9887      4.79 
            
            ----total-cpu-usage---- -dsk/total- -net/bond0- ---paging-- ---system--
            usr sys idl wai hiq siq| read  writ| recv  send|  in   out | int   csw 
              0   5  73  22   0   0|  11M    0 |9051k 9150k|   0     0 |  52k  158k
              0   4  74  22   0   0|  12M   85M|8408k 8479k|   0     0 |  48k  152k
              0   1  74  24   0   0|6424k  525k|9324k 9598k|   0     0 |  23k   51k
              0   0  88  12   0   0|8192B 4096B|6604k 6973k|   0     0 |1366  2319 
              0   0  69  31   0   0|   0    16k|  70k   37k|   0     0 | 423   561 
              0   0  69  31   0   0|   0     0 |  82k   86k|   0     0 | 359   483 
              0   0  69  31   0   0|   0   116k|  14k 5632B|   0     0 | 228   358 
              0   0  69  31   0   0|   0    36k|9634B 5207B|   0     0 | 359   502 
              0   3  75  22   0   0|  10M   30M|  14k 5888B|   0     0 |  41k  100k
              0   3  72  25   0   0|  11M   15M|5462k 5440k|   0     0 |  42k  103k
              0   2  73  25   0   0|  11M   12M|7685k 7958k|   0     0 |  38k   92k
              0   3  65  32   0   0|  11M   17M|7911k 7944k|   0     0 |  47k  113k
            
            daire Daire Byrne (Inactive) added a comment - Seeing the drop to zero transactions a lot less frequently now and they never last more than a couple of seconds. Maybe every 30+ mins instead of every couple of mins... Certainly a lot better than it was. The overall throughput graphs are showing a noticeable increase too. Here's and example of a stall that happened just now: req_waittime 10357 10357 57808929 [usec] 70735 2 6.59 9887 4.80 req_waittime 11138 11138 57820067 [usec] 74281 2 6.59 9887 4.80 req_waittime 13940 13940 57834007 [usec] 97575 2 6.59 9887 4.80 req_waittime 11907 11907 57845914 [usec] 82263 2 6.59 9887 4.80 req_waittime 11521 11521 57857435 [usec] 79703 2 6.59 9887 4.80 req_waittime 2642 2642 57860077 [usec] 17844 2 6.59 9887 4.80 req_waittime 5 5 57860082 [usec] 128 2 6.59 9887 4.80 req_waittime 1 1 57860083 [usec] 32 2 6.59 9887 4.80 req_waittime 2 2 57860085 [usec] 43 2 6.59 9887 4.80 req_waittime 0 0 57860085 [usec] 0 2 6.59 9887 4.80 req_waittime 902 902 57860987 [usec] 6832 2 6.59 9887 4.80 req_waittime 11040 11040 57872027 [usec] 73828 2 6.59 9887 4.80 req_waittime 8804 8804 57880831 [usec] 61287 2 6.59 9887 4.80 req_waittime 9867 9867 57890698 [usec] 66307 2 6.59 9887 4.79 req_waittime 11310 11310 57902008 [usec] 75206 2 6.59 9887 4.79 req_waittime 11138 11138 57913146 [usec] 74315 2 6.59 9887 4.79 req_waittime 9425 9425 57922571 [usec] 61696 2 6.59 9887 4.79 ----total-cpu-usage---- -dsk/total- -net/bond0- ---paging-- ---system-- usr sys idl wai hiq siq| read writ| recv send| in out | int csw 0 5 73 22 0 0| 11M 0 |9051k 9150k| 0 0 | 52k 158k 0 4 74 22 0 0| 12M 85M|8408k 8479k| 0 0 | 48k 152k 0 1 74 24 0 0|6424k 525k|9324k 9598k| 0 0 | 23k 51k 0 0 88 12 0 0|8192B 4096B|6604k 6973k| 0 0 |1366 2319 0 0 69 31 0 0| 0 16k| 70k 37k| 0 0 | 423 561 0 0 69 31 0 0| 0 0 | 82k 86k| 0 0 | 359 483 0 0 69 31 0 0| 0 116k| 14k 5632B| 0 0 | 228 358 0 0 69 31 0 0| 0 36k|9634B 5207B| 0 0 | 359 502 0 3 75 22 0 0| 10M 30M| 14k 5888B| 0 0 | 41k 100k 0 3 72 25 0 0| 11M 15M|5462k 5440k| 0 0 | 42k 103k 0 2 73 25 0 0| 11M 12M|7685k 7958k| 0 0 | 38k 92k 0 3 65 32 0 0| 11M 17M|7911k 7944k| 0 0 | 47k 113k

            it doesn't look stalling at any point? are you still seeing gaps with llstat ?

            bzzz Alex Zhuravlev added a comment - it doesn't look stalling at any point? are you still seeing gaps with llstat ?

            The load and IO wait seems to be consistently higher than it used to be so I guess that is a good sign that we are doing more work overall than we were before the external journal. In this snippet the req_waittime was around 4,000/s and then increased to around 14,000 for some time.

            procs -----------memory---------- ---swap-- -----io---- --system-- -----cpu-----
             r  b   swpd   free   buff  cache   si   so    bi    bo   in   cs us sy id wa st
             0 35      0 153068944 76469912 530164    0    0  5340  2080 33554 73880  0  2 69 29  0
             2 33      0 153049840 76478664 530904    0    0  5888     0 33074 75321  0  2 69 29  0
             0 36      0 153039680 76488400 529812    0    0  6712  6450 39886 89002  0  2 72 26  0
             2 33      0 153029568 76494808 530492    0    0  4284 59700 36049 136657  0  2 70 28  0
             0 14      0 153025168 76500336 531188    0    0  4240  2064 23191 47842  0  1 71 28  0
             0 16      0 153028528 76501656 531352    0    0  1240  4168 14398 27798  0  1 81 19  0
             2 35      0 153010848 76510256 529632    0    0  6136  4144 38677 82843  0  2 70 28  0
             0 15      0 153009856 76513080 531240    0    0  2360  4144 20287 36438  0  1 80 19  0
             2 31      0 153002480 76520320 529444    0    0  5808 37772 35445 136320  0  2 71 26  0
             0 32      0 152982288 76532400 530672    0    0  8752  6192 47392 105233  0  3 69 28  0
             0 14      0 152969552 76539408 529064    0    0  5896  6240 30985 60270  0  2 73 25  0
             0 31      0 152956768 76545224 530080    0    0  4768  8304 29606 58896  0  2 80 19  0
             0 24      0 152930224 76562528 529352    0    0 14392  4224 60441 143758  0  4 70 26  0
             5 26      0 152912704 76578672 529636    0    0 14068 71680 58179 184156  0  4 63 33  0
             1 23      0 152887104 76594720 531316    0    0 13708  4160 59833 142103  0  4 68 28  0
             1 21      0 152859648 76609600 530468    0    0 11764  2088 55286 128557  0  3 63 33  0
             2 29      0 152835968 76624656 530008    0    0 12752  6208 49436 108952  0  3 68 29  0
             0 28      0 152812096 76639664 530384    0    0 12116  2080 56040 134488  0  4 73 24  0
            
            daire Daire Byrne (Inactive) added a comment - The load and IO wait seems to be consistently higher than it used to be so I guess that is a good sign that we are doing more work overall than we were before the external journal. In this snippet the req_waittime was around 4,000/s and then increased to around 14,000 for some time. procs -----------memory---------- ---swap-- -----io---- --system-- -----cpu----- r b swpd free buff cache si so bi bo in cs us sy id wa st 0 35 0 153068944 76469912 530164 0 0 5340 2080 33554 73880 0 2 69 29 0 2 33 0 153049840 76478664 530904 0 0 5888 0 33074 75321 0 2 69 29 0 0 36 0 153039680 76488400 529812 0 0 6712 6450 39886 89002 0 2 72 26 0 2 33 0 153029568 76494808 530492 0 0 4284 59700 36049 136657 0 2 70 28 0 0 14 0 153025168 76500336 531188 0 0 4240 2064 23191 47842 0 1 71 28 0 0 16 0 153028528 76501656 531352 0 0 1240 4168 14398 27798 0 1 81 19 0 2 35 0 153010848 76510256 529632 0 0 6136 4144 38677 82843 0 2 70 28 0 0 15 0 153009856 76513080 531240 0 0 2360 4144 20287 36438 0 1 80 19 0 2 31 0 153002480 76520320 529444 0 0 5808 37772 35445 136320 0 2 71 26 0 0 32 0 152982288 76532400 530672 0 0 8752 6192 47392 105233 0 3 69 28 0 0 14 0 152969552 76539408 529064 0 0 5896 6240 30985 60270 0 2 73 25 0 0 31 0 152956768 76545224 530080 0 0 4768 8304 29606 58896 0 2 80 19 0 0 24 0 152930224 76562528 529352 0 0 14392 4224 60441 143758 0 4 70 26 0 5 26 0 152912704 76578672 529636 0 0 14068 71680 58179 184156 0 4 63 33 0 1 23 0 152887104 76594720 531316 0 0 13708 4160 59833 142103 0 4 68 28 0 1 21 0 152859648 76609600 530468 0 0 11764 2088 55286 128557 0 3 63 33 0 2 29 0 152835968 76624656 530008 0 0 12752 6208 49436 108952 0 3 68 29 0 0 28 0 152812096 76639664 530384 0 0 12116 2080 56040 134488 0 4 73 24 0

            could you grab another vmstat output ?

            bzzz Alex Zhuravlev added a comment - could you grab another vmstat output ?

            Yea obviously forgot to apply sync_permissions=0. So now it looks like:

            66188 transaction, each up to 65536 blocks
            average: 
              2ms waiting for transaction
              49ms running transaction
              3ms transaction was being locked
              0ms flushing data (in ordered mode)
              0ms logging transaction
              48370us average transaction commit time
              196 handles per transaction
              167 blocks per transaction
              168 logged blocks per transaction
            

            It seems so far like the periods of "no activity" have been reduced but the rate of transactions still varies quite a lot. I think we'll still go ahead and compare the same hardware on v1.8.9. It just feels like the ext4/RAID sync is really really expensive with the current config. We need the metadata rate to be more consistent and predictable.

            Cheers.

            daire Daire Byrne (Inactive) added a comment - Yea obviously forgot to apply sync_permissions=0. So now it looks like: 66188 transaction, each up to 65536 blocks average: 2ms waiting for transaction 49ms running transaction 3ms transaction was being locked 0ms flushing data (in ordered mode) 0ms logging transaction 48370us average transaction commit time 196 handles per transaction 167 blocks per transaction 168 logged blocks per transaction It seems so far like the periods of "no activity" have been reduced but the rate of transactions still varies quite a lot. I think we'll still go ahead and compare the same hardware on v1.8.9. It just feels like the ext4/RAID sync is really really expensive with the current config. We need the metadata rate to be more consistent and predictable. Cheers.

            People

              bzzz Alex Zhuravlev
              daire Daire Byrne (Inactive)
              Votes:
              0 Vote for this issue
              Watchers:
              6 Start watching this issue

              Dates

                Created:
                Updated:
                Resolved: