Details
-
Bug
-
Resolution: Cannot Reproduce
-
 Minor
Minor
-
None
-
Lustre 2.4.0
-
None
-
3
-
9680
Description
Hi,
I have been investigating why our metadata rate keeps dropping to nothing every 30 seconds or so for a few seconds at a time. Looking at the debug logs it looks like it is stuck doing many osp_sync_request_commit_cb() calls. I shouldn't think this should block all other operations so maybe this is not the issue and it's just that these are the only operations that are occurring when we see the rate drop to zero. I'm pretty sure the RAID and storage path is all fine. Here is a snippet illustrating the issue:
/proc/fs/lustre/mds/MDS/mdt/stats @ 1375970781.677198
Name Cur.Count Cur.Rate #Events Unit last min avg max stddev
req_waittime 0 0 803871957 [usec] 0 2 6.63 10477 8.15
req_qdepth 0 0 803871957 [reqs] 0 0 0.00 12 0.07
req_active 0 0 803871957 [reqs] 0 1 2.67 16 1.79
req_timeout 0 0 803871957 [sec] 0 1 15.50 37 14.29
reqbuf_avail 0 0 1709293570[bufs] 0 47 63.79 64 0.59
ldlm_ibits_enqueue 0 0 499159709 [reqs] 0 1 1.00 1 0.00
mds_getattr 0 0 3152776 [usec] 0 8 346.15 1453985 6393.00
mds_getattr_lock 0 0 158194 [usec] 0 9 83.28 381776 1418.81
mds_connect 0 0 76 [usec] 0 14 3477.13 147911 21249.32
mds_disconnect 0 0 19 [usec] 0 26 1178.21 15598 3757.50
mds_getstatus 0 0 4 [usec] 0 9 13.75 16 3.20
mds_statfs 0 0 2904 [usec] 0 5 19.87 2115 67.53
mds_sync 0 0 3 [usec] 0 116 10933.67 32562 18730.69
mds_getxattr 0 0 50841 [usec] 0 6 12.89 92 3.91
obd_ping 0 0 530449 [usec] 0 3 11.87 3851 8.76
00000004:00080000:4.0:1375970781.689383:0:4870:0:(osp_sync.c:317:osp_sync_request_commit_cb()) commit req ffff8821062c4000, transno 8617232460
00000004:00080000:4.0:1375970781.689384:0:4870:0:(osp_sync.c:317:osp_sync_request_commit_cb()) commit req ffff882d394d4c00, transno 8617232461
00000004:00080000:4.0:1375970781.689384:0:4870:0:(osp_sync.c:317:osp_sync_request_commit_cb()) commit req ffff883e03485800, transno 8617232462
00000004:00080000:4.0:1375970781.689385:0:4870:0:(osp_sync.c:317:osp_sync_request_commit_cb()) commit req ffff883479fcdc00, transno 8617232463
00000004:00080000:4.0:1375970781.689386:0:4870:0:(osp_sync.c:317:osp_sync_request_commit_cb()) commit req ffff883515c1f400, transno 8617232464
00000004:00080000:4.0:1375970781.689387:0:4870:0:(osp_sync.c:317:osp_sync_request_commit_cb()) commit req ffff883d76783000, transno 8617232465
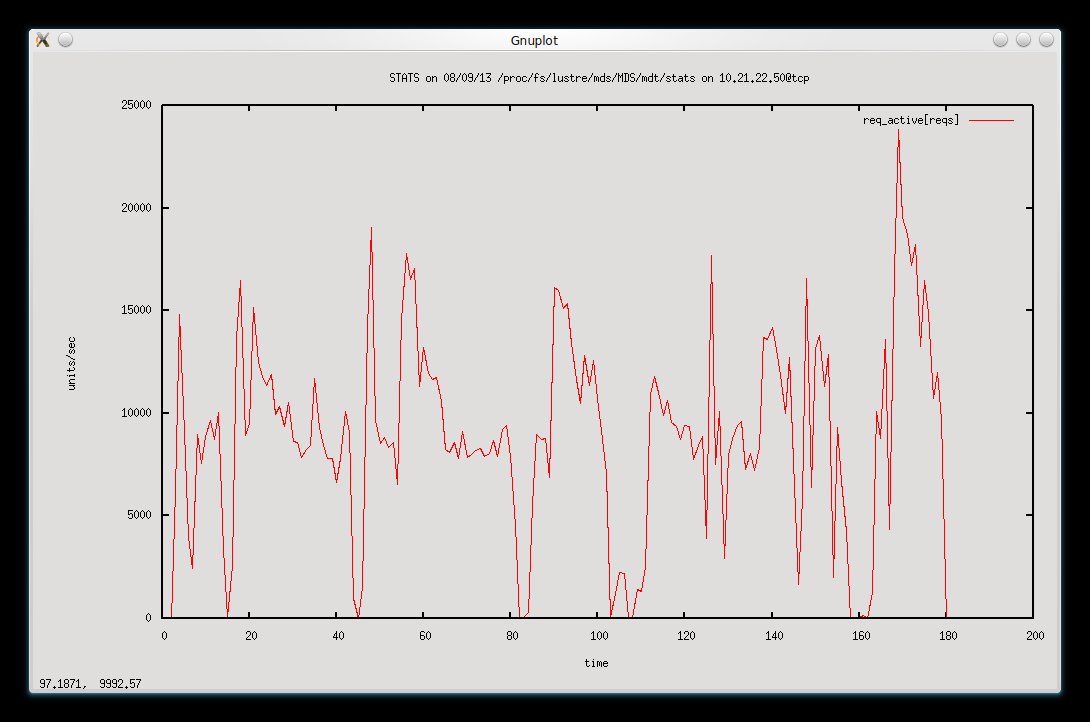
I am also attaching a graph showing the MDS rate drops over a few minutes. I can upload some full debug logs from the MDS when the rate drops to zero if that helps.
The workload is running on two clients and copies, hard links and unlinks thousands of directory trees. The two clients suffer performance drops at the same time as the MDS rate drops to zero.
Cheers,
Daire
Attachments
Issue Links
- is related to
-
-

- Resolved
-
Activity
Yea obviously forgot to apply sync_permissions=0. So now it looks like:
66188 transaction, each up to 65536 blocks
average:
  2ms waiting for transaction
  49ms running transaction
  3ms transaction was being locked
  0ms flushing data (in ordered mode)
  0ms logging transaction
  48370us average transaction commit time
  196 handles per transaction
  167 blocks per transaction
  168 logged blocks per transaction
It seems so far like the periods of "no activity" have been reduced but the rate of transactions still varies quite a lot. I think we'll still go ahead and compare the same hardware on v1.8.9. It just feels like the ext4/RAID sync is really really expensive with the current config. We need the metadata rate to be more consistent and predictable.
Cheers.
hmm, 3 handles per transaction isn't good at all. sync_permission=0 ?
Well it helped with the journal transaction times but the constant pausing is still present. Actually it may be even more frequent and regular now. Oh well, a reformat to v1.8.9 will be more instructive.
bmds1 /root # cat /proc/fs/jbd2/sdb/info
2283745 transaction, each up to 65536 blocks
average:
  0ms waiting for transaction
  2ms running transaction
  0ms transaction was being locked
  0ms flushing data (in ordered mode)
  0ms logging transaction
  152us average transaction commit time
  4 handles per transaction
  12 blocks per transaction
  13 logged blocks per transaction
I'll try this:
mke2fs -b 4096 -O journal_dev /dev/sdb 262144
tune2fs -O ^has_journal /dev/lustre/mdt1
tune2fs -o journal_data -j -J device=/dev/sdb /dev/lustre/mdt1
Well we can easily add some SSDs to the MDS server. Is it fairly easy to create an external journal to an existing MDT filesystem? It is worth a try before we reformat v1.8.9.
if you have additional storage on MDS node, I'd try with an external journal.. but 1.8 would be interesting, definitely.
So I think the best course of action now is to install Lustre v1.8.9 on this hardware and compare the performance with the same workload. Unfortunately we will have to change one element - the v1.8.9 Whamcloud kernel (EL6.2) does not have support for the RAID10 LVM layout we are currently using (EL6.4) so we will have to use a MD RAID10 with an LVM on top.
I will report back later next week once this work has been done. Thanks for your time.
I wonder if mounting with "nobarrier" will help? e.g. #LU-979
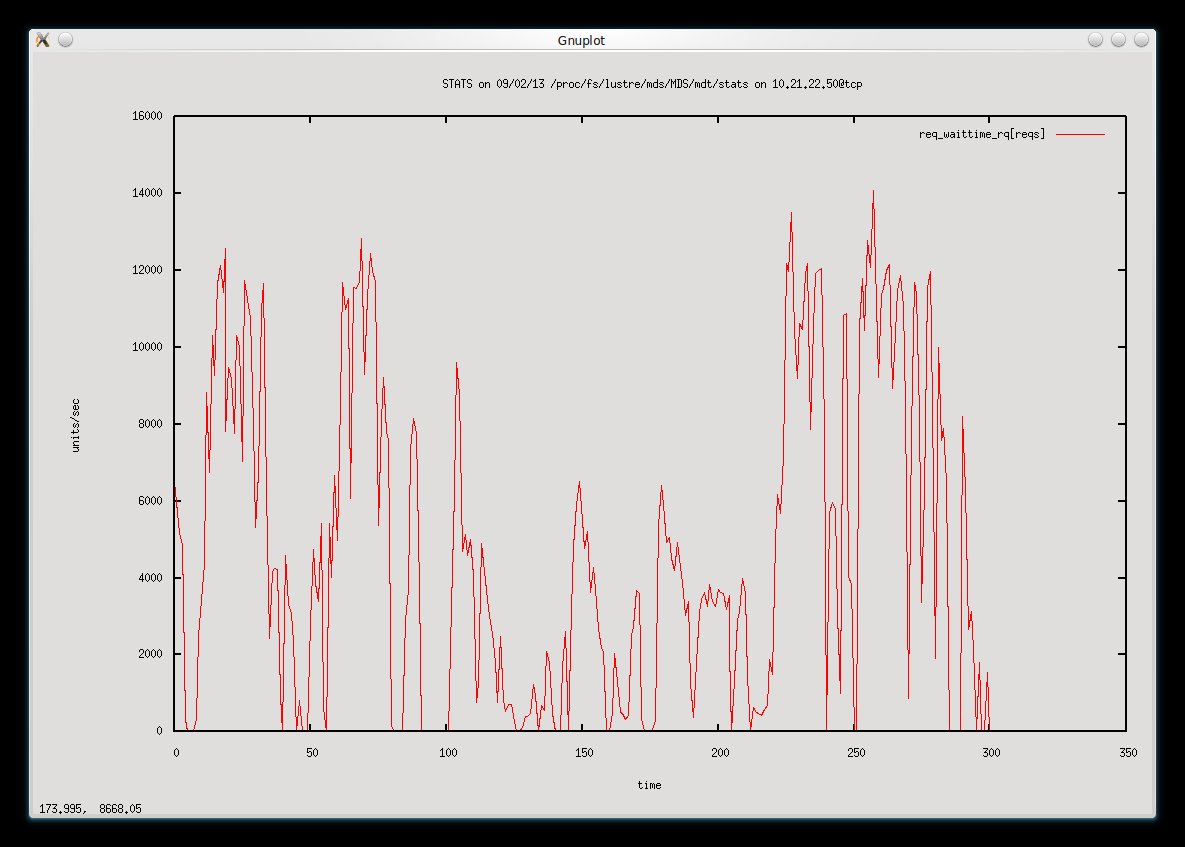
The load and IO wait seems to be consistently higher than it used to be so I guess that is a good sign that we are doing more work overall than we were before the external journal. In this snippet the req_waittime was around 4,000/s and then increased to around 14,000 for some time.