Details

    • Improvement
    • Resolution: Fixed
    • Critical
    • None
    • Lustre 2.9.0
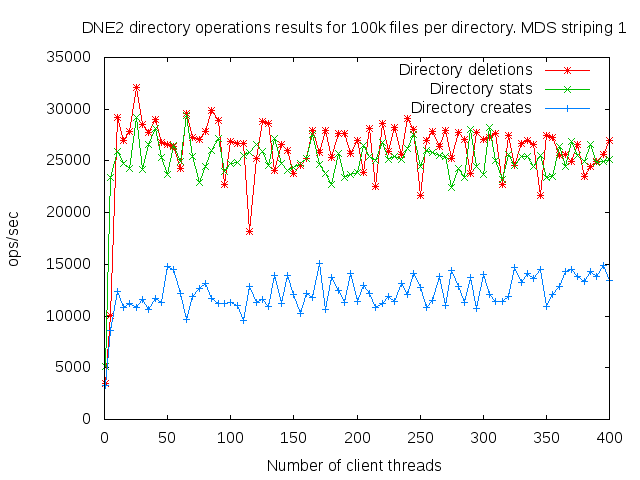
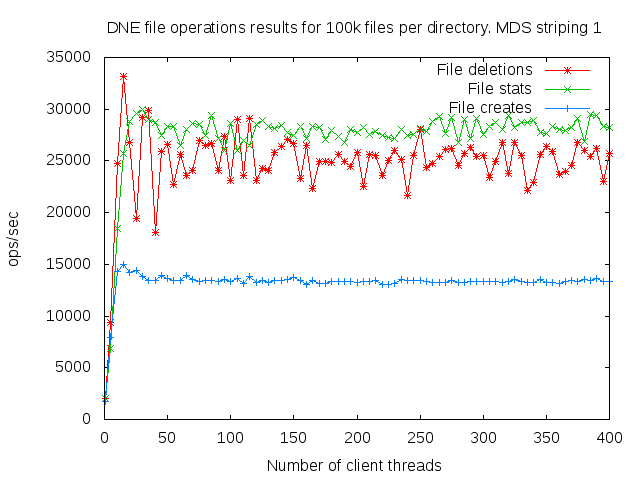
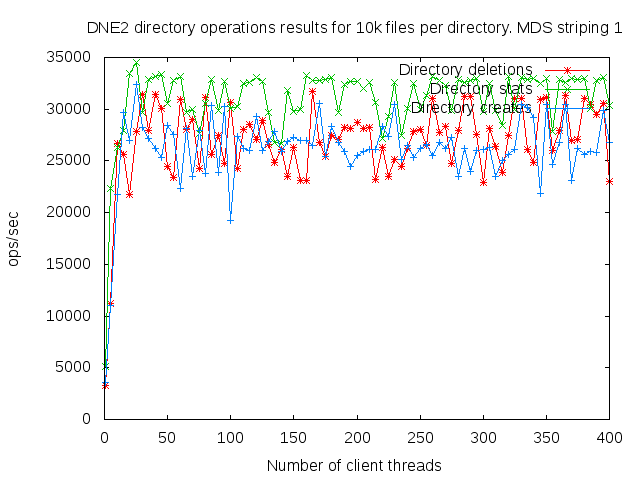
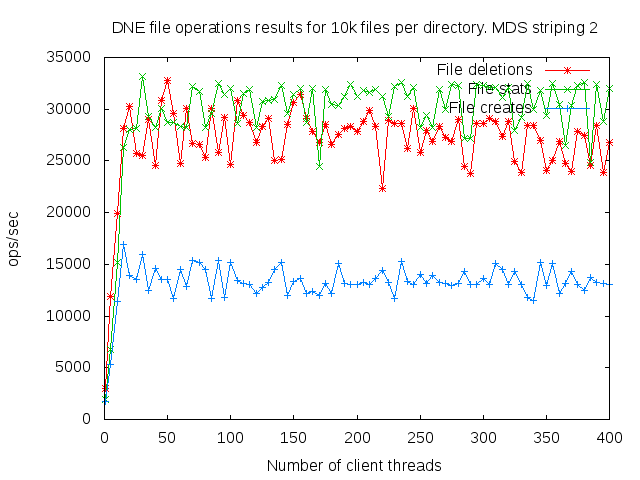
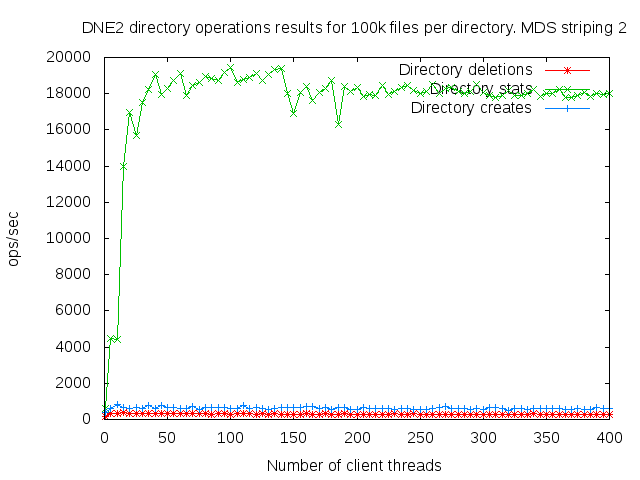
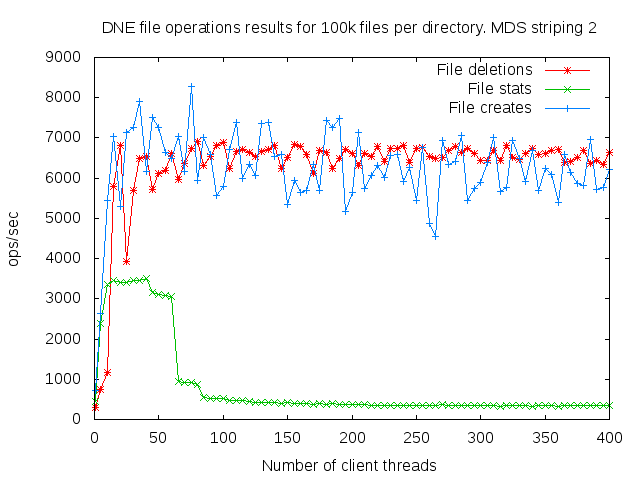
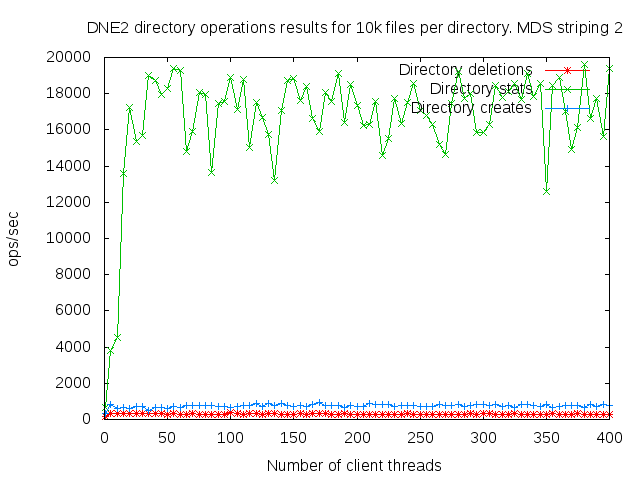
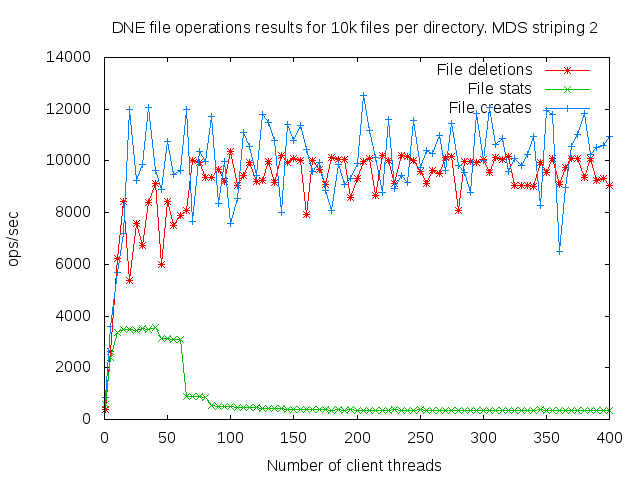
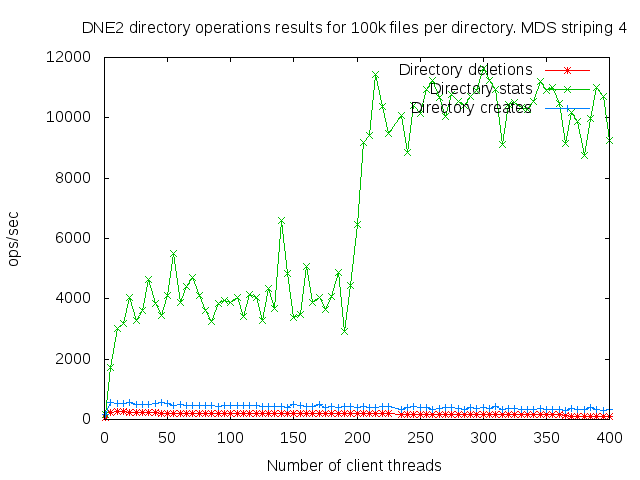
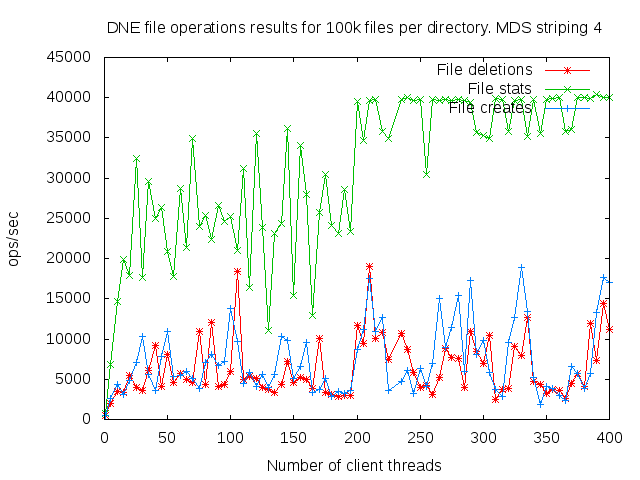
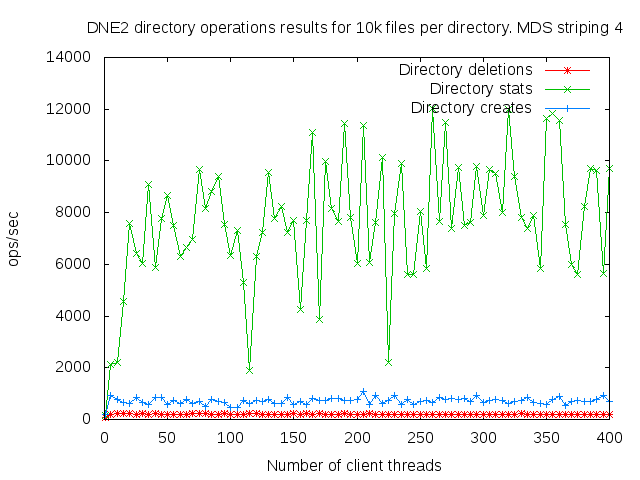
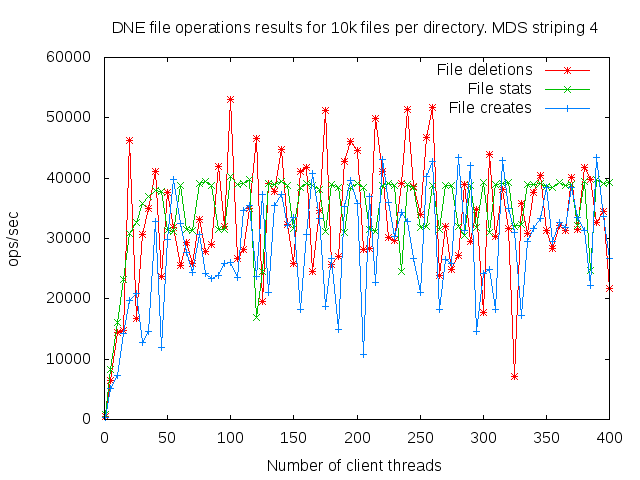
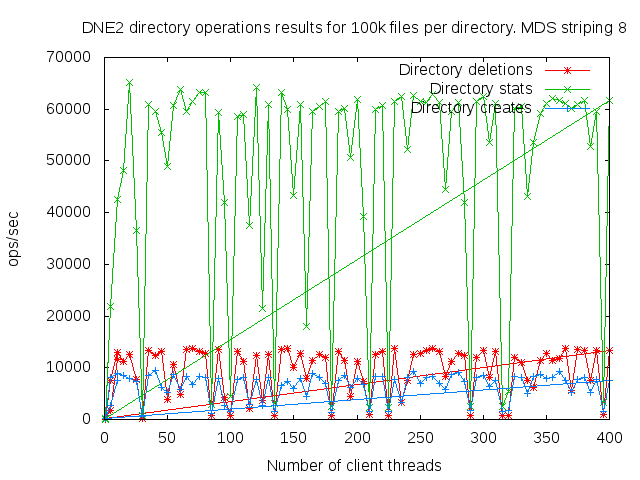
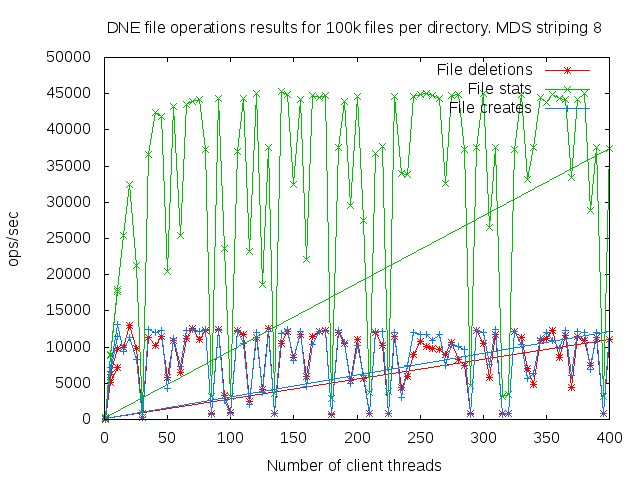
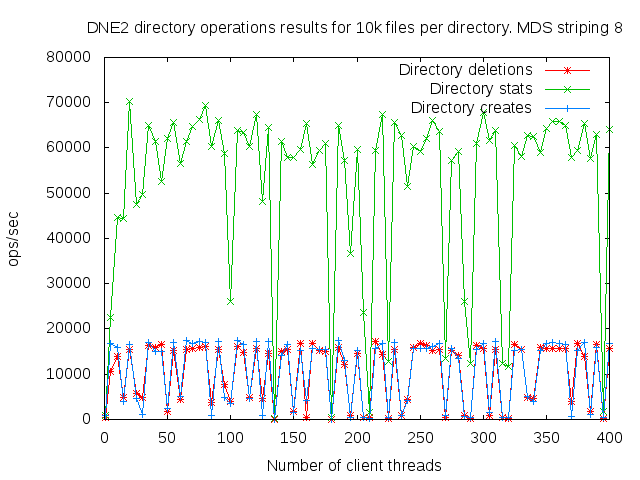
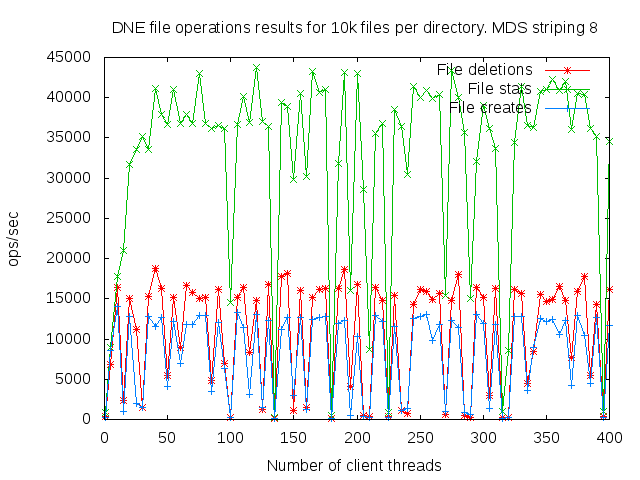
    • DNE2 system with up to 16 MDS servers. Uses up to 400 client nodes spread across 20 physical nodes. All the results are based on mdtest 1.9.3 runs.
    • 9223372036854775807

    Description

      I did a detail study of the client scaling behavior for 10k and 100k files per directory using 1,2,4, and 8 MDS servers each having one MDT. I also attempted to collect dat for 16 MDS servers but the results were so bad I didn't both to finish collecting them since it would take several months to finish the 16 node case.

      Attachments

        1. 1-mds-dne2-100k-dir-2.8.png
          1-mds-dne2-100k-dir-2.8.png
          12 kB
        2. 1-mds-dne2-100k-files-2.8.png
          1-mds-dne2-100k-files-2.8.png
          11 kB
        3. 1-mds-dne2-10k-dir-2.8.png
          1-mds-dne2-10k-dir-2.8.png
          13 kB
        4. 1-mds-dne2-10k-files-2.8.png
          1-mds-dne2-10k-files-2.8.png
          12 kB
        5. 2-mds-dne2-100k-dir-2.8.png
          2-mds-dne2-100k-dir-2.8.png
          8 kB
        6. 2-mds-dne2-100k-files-2.8.png
          2-mds-dne2-100k-files-2.8.png
          11 kB
        7. 2-mds-dne2-10k-dir-2.8.png
          2-mds-dne2-10k-dir-2.8.png
          10 kB
        8. 2-mds-dne2-10k-files-2.8.png
          2-mds-dne2-10k-files-2.8.png
          11 kB
        9. 4-mds-dne2-100k-dir-2.8.png
          4-mds-dne2-100k-dir-2.8.png
          9 kB
        10. 4-mds-dne2-100k-files-2.8.png
          4-mds-dne2-100k-files-2.8.png
          13 kB
        11. 4-mds-dne2-10k-dir-2.8.png
          4-mds-dne2-10k-dir-2.8.png
          11 kB
        12. 4-mds-dne2-10k-files-2.8.png
          4-mds-dne2-10k-files-2.8.png
          14 kB
        13. 8-mds-dne2-100k-dir-2.8.png
          8-mds-dne2-100k-dir-2.8.png
          14 kB
        14. 8-mds-dne2-100k-files-2.8.png
          8-mds-dne2-100k-files-2.8.png
          15 kB
        15. 8-mds-dne2-10k-dir-2.8.png
          8-mds-dne2-10k-dir-2.8.png
          13 kB
        16. 8-mds-dne2-10k-files-2.8.png
          8-mds-dne2-10k-files-2.8.png
          14 kB
        17. mdtest-scale.pbs
          0.9 kB

        Issue Links

          Activity

            [LU-7293] DNE2 perfomance analysis

            Here is the final report of our results for our DNE2 performance analysis

            http://info.ornl.gov/sites/publications/Files/Pub59510.pdf

            Enjoy the read. Perhaps we can link it to the wiki. If people want it linked to the wiki we can do that
            and then close this ticket. If not we can keep this ticket open for a few more weeks so people can
            have a chance to read this.

            simmonsja James A Simmons added a comment - Here is the final report of our results for our DNE2 performance analysis http://info.ornl.gov/sites/publications/Files/Pub59510.pdf Enjoy the read. Perhaps we can link it to the wiki. If people want it linked to the wiki we can do that and then close this ticket. If not we can keep this ticket open for a few more weeks so people can have a chance to read this.

            Oh this doesn't look right.

            ldlm.namespaces.sultan-MDT0000-mdc-ffff8803f3d12c00.lru_size=29
            ldlm.namespaces.sultan-MDT0001-mdc-ffff8803f3d12c00.lru_size=0
            ldlm.namespaces.sultan-MDT0002-mdc-ffff8803f3d12c00.lru_size=0
            ldlm.namespaces.sultan-MDT0003-mdc-ffff8803f3d12c00.lru_size=0
            ldlm.namespaces.sultan-MDT0004-mdc-ffff8803f3d12c00.lru_size=0
            ldlm.namespaces.sultan-MDT0005-mdc-ffff8803f3d12c00.lru_size=0
            ldlm.namespaces.sultan-MDT0006-mdc-ffff8803f3d12c00.lru_size=0
            ldlm.namespaces.sultan-MDT0007-mdc-ffff8803f3d12c00.lru_size=0
            ldlm.namespaces.sultan-MDT0008-mdc-ffff8803f3d12c00.lru_size=0
            ldlm.namespaces.sultan-MDT0009-mdc-ffff8803f3d12c00.lru_size=0
            ldlm.namespaces.sultan-MDT000a-mdc-ffff8803f3d12c00.lru_size=0
            ldlm.namespaces.sultan-MDT000b-mdc-ffff8803f3d12c00.lru_size=0
            ldlm.namespaces.sultan-MDT000c-mdc-ffff8803f3d12c00.lru_size=0
            ldlm.namespaces.sultan-MDT000d-mdc-ffff8803f3d12c00.lru_size=0
            ldlm.namespaces.sultan-MDT000e-mdc-ffff8803f3d12c00.lru_size=0
            ldlm.namespaces.sultan-MDT000f-mdc-ffff8803f3d12c00.lru_size=0

            simmonsja James A Simmons added a comment - Oh this doesn't look right. ldlm.namespaces.sultan-MDT0000-mdc-ffff8803f3d12c00.lru_size=29 ldlm.namespaces.sultan-MDT0001-mdc-ffff8803f3d12c00.lru_size=0 ldlm.namespaces.sultan-MDT0002-mdc-ffff8803f3d12c00.lru_size=0 ldlm.namespaces.sultan-MDT0003-mdc-ffff8803f3d12c00.lru_size=0 ldlm.namespaces.sultan-MDT0004-mdc-ffff8803f3d12c00.lru_size=0 ldlm.namespaces.sultan-MDT0005-mdc-ffff8803f3d12c00.lru_size=0 ldlm.namespaces.sultan-MDT0006-mdc-ffff8803f3d12c00.lru_size=0 ldlm.namespaces.sultan-MDT0007-mdc-ffff8803f3d12c00.lru_size=0 ldlm.namespaces.sultan-MDT0008-mdc-ffff8803f3d12c00.lru_size=0 ldlm.namespaces.sultan-MDT0009-mdc-ffff8803f3d12c00.lru_size=0 ldlm.namespaces.sultan-MDT000a-mdc-ffff8803f3d12c00.lru_size=0 ldlm.namespaces.sultan-MDT000b-mdc-ffff8803f3d12c00.lru_size=0 ldlm.namespaces.sultan-MDT000c-mdc-ffff8803f3d12c00.lru_size=0 ldlm.namespaces.sultan-MDT000d-mdc-ffff8803f3d12c00.lru_size=0 ldlm.namespaces.sultan-MDT000e-mdc-ffff8803f3d12c00.lru_size=0 ldlm.namespaces.sultan-MDT000f-mdc-ffff8803f3d12c00.lru_size=0

            Hmm, according to the slab information in Nov 15th, it seems "lustre_inode_cache" is much more than "inode_cache", so it means client has more ll_inode_info than inode, hmm, maybe ll_inode_info is leaked somewhere. Do you still keep that client? Could you please get lru_size for me?

            lctl get_param ldlm.*.*MDT*.lru_size
            
            di.wang Di Wang (Inactive) added a comment - Hmm, according to the slab information in Nov 15th, it seems "lustre_inode_cache" is much more than "inode_cache", so it means client has more ll_inode_info than inode, hmm, maybe ll_inode_info is leaked somewhere. Do you still keep that client? Could you please get lru_size for me? lctl get_param ldlm.*.*MDT*.lru_size

            I did both file only operations and with directory operations. I did tracked down the issue of directory operations as well. What is happening in that case is that the lustre inode cache is consuming all the memory on the client thus causing various timeout and client evictions and reconnects. This only happens for when many directory operations are performed. When only doing file operations the memory pressure issues go away. My latest testings as all been without the --index.

            simmonsja James A Simmons added a comment - I did both file only operations and with directory operations. I did tracked down the issue of directory operations as well. What is happening in that case is that the lustre inode cache is consuming all the memory on the client thus causing various timeout and client evictions and reconnects. This only happens for when many directory operations are performed. When only doing file operations the memory pressure issues go away. My latest testings as all been without the --index.
            di.wang Di Wang (Inactive) added a comment - - edited

            James: did this only happen when you do directory creation? or both file and directory creation? how many threads per client? Thanks

            Btw: did you rerun the test with "-F" and remove --index for default stripeEA as comment in Oct 18th. Thanks

            di.wang Di Wang (Inactive) added a comment - - edited James: did this only happen when you do directory creation? or both file and directory creation? how many threads per client? Thanks Btw: did you rerun the test with "-F" and remove --index for default stripeEA as comment in Oct 18th. Thanks

            On the client side I see with perf and slab top:

            + 30.58% swapper [kernel.kallsyms] [k] __schedule -
            + 12.16% pbs_mom [unknown] [.] 0x7f198dcd6ea3 0
            + 6.21% apsys [unknown] [.] 0x407a76 ▒
            + 2.03% ptlrpcd_00_02 [kernel.kallsyms] [k] __switch_to ▒
            + 1.32% swapper [kernel.kallsyms] [k] read_tsc ▒
            + 1.04% swapper [kernel.kallsyms] [k] load_balance ▒
            + 0.93% swapper [kernel.kallsyms] [k] sched_clock_local ▒
            + 0.90% kworker/3:1 [kernel.kallsyms] [k] rt_worker_func ▒
            + 0.86% pbs_mom [kernel.kallsyms] [k] copy_pte_range ▒
            + 0.74% swapper [kernel.kallsyms] [k] default_idle ▒
            + 0.73% swapper [kernel.kallsyms] [k] run_timer_softirq ▒
            + 0.63% swapper [kernel.kallsyms] [k] trace_hardirqs_off ▒
            + 0.58% swapper [kernel.kallsyms] [k] ktime_get ▒
            + 0.55% pbs_mom [kernel.kallsyms] [k] vsnprintf ▒
            + 0.42% swapper [kernel.kallsyms] [k] get_next_timer_interrupt ▒
            + 0.40% swapper [kernel.kallsyms] [k] apic_timer_interrupt ▒
            + 0.37% ptlrpcd_00_00 [kernel.kallsyms] [k] _raw_spin_lock ▒
            + 0.36% munged [unknown] [.] 0x409380 ▒
            + 0.34% apsys [kernel.kallsyms] [k] page_fault ▒
            + 0.33% pbs_mom [kernel.kallsyms] [k] number ▒
            + 0.33% nscd [unknown] [.] 0x7ffb57c0866f ▒
            + 0.32% swapper [kernel.kallsyms] [k] amd_e400_idle ▒
            + 0.32% swapper [kernel.kallsyms] [k] _raw_spin_lock ▒
            + 0.30% swapper [kernel.kallsyms] [k] cpumask_next_and ▒
            + 0.29% pbs_mom [kernel.kallsyms] [k] __do_fault ▒
            + 0.29% swapper [kernel.kallsyms] [k] rcu_exit_nohz ▒
            + 0.28% swapper [kernel.kallsyms] [k] x86_pmu_enable_all ▒
            + 0.27% swapper [kernel.kallsyms] [k] native_sched_clock ▒
            + 0.26% pbs_mom [kernel.kallsyms] [k] do_task_stat

            Active / Total Objects (% used) : 6238442 / 6248913 (99.8%)
            Active / Total Slabs (% used) : 878492 / 878500 (100.0%)
            Active / Total Caches (% used) : 108 / 227 (47.6%)
            Active / Total Size (% used) : 6911389.05K / 6913362.17K (100.0%)
            Minimum / Average / Maximum Object : 0.02K / 1.11K / 32768.00K

            OBJS ACTIVE USE OBJ SIZE SLABS OBJ/SLAB CACHE SIZE NAME
            6038739 6038710 99% 1.12K 862677 7 6901416K lustre_inode_cache
            49820 49806 99% 0.19K 2491 20 9964K dentry
            48160 47939 99% 0.03K 430 112 1720K size-32
            18236 18232 99% 0.99K 4559 4 18236K nfs_inode_cache
            17040 16731 98% 0.12K 568 30 2272K size-128
            13806 13346 96% 0.06K 234 59 936K size-64
            7832 7790 99% 0.09K 178 44 712K sysfs_dir_cache
            7329 7309 99% 0.57K 1047 7 4188K inode_cache
            6440 6276 97% 0.19K 322 20 1288K size-192
            5159 2745 53% 0.05K 67 77 268K anon_vma_chain
            3976 3761 94% 0.50K 497 8 1988K size-512

            Here you can see the client nodes are pegged due to swapper running constantly due to the memory pressure on the client. The lustre_inode_cache is huge.

            simmonsja James A Simmons added a comment - On the client side I see with perf and slab top: + 30.58% swapper [kernel.kallsyms] [k] __schedule - + 12.16% pbs_mom [unknown] [.] 0x7f198dcd6ea3 0 + 6.21% apsys [unknown] [.] 0x407a76 ▒ + 2.03% ptlrpcd_00_02 [kernel.kallsyms] [k] __switch_to ▒ + 1.32% swapper [kernel.kallsyms] [k] read_tsc ▒ + 1.04% swapper [kernel.kallsyms] [k] load_balance ▒ + 0.93% swapper [kernel.kallsyms] [k] sched_clock_local ▒ + 0.90% kworker/3:1 [kernel.kallsyms] [k] rt_worker_func ▒ + 0.86% pbs_mom [kernel.kallsyms] [k] copy_pte_range ▒ + 0.74% swapper [kernel.kallsyms] [k] default_idle ▒ + 0.73% swapper [kernel.kallsyms] [k] run_timer_softirq ▒ + 0.63% swapper [kernel.kallsyms] [k] trace_hardirqs_off ▒ + 0.58% swapper [kernel.kallsyms] [k] ktime_get ▒ + 0.55% pbs_mom [kernel.kallsyms] [k] vsnprintf ▒ + 0.42% swapper [kernel.kallsyms] [k] get_next_timer_interrupt ▒ + 0.40% swapper [kernel.kallsyms] [k] apic_timer_interrupt ▒ + 0.37% ptlrpcd_00_00 [kernel.kallsyms] [k] _raw_spin_lock ▒ + 0.36% munged [unknown] [.] 0x409380 ▒ + 0.34% apsys [kernel.kallsyms] [k] page_fault ▒ + 0.33% pbs_mom [kernel.kallsyms] [k] number ▒ + 0.33% nscd [unknown] [.] 0x7ffb57c0866f ▒ + 0.32% swapper [kernel.kallsyms] [k] amd_e400_idle ▒ + 0.32% swapper [kernel.kallsyms] [k] _raw_spin_lock ▒ + 0.30% swapper [kernel.kallsyms] [k] cpumask_next_and ▒ + 0.29% pbs_mom [kernel.kallsyms] [k] __do_fault ▒ + 0.29% swapper [kernel.kallsyms] [k] rcu_exit_nohz ▒ + 0.28% swapper [kernel.kallsyms] [k] x86_pmu_enable_all ▒ + 0.27% swapper [kernel.kallsyms] [k] native_sched_clock ▒ + 0.26% pbs_mom [kernel.kallsyms] [k] do_task_stat Active / Total Objects (% used) : 6238442 / 6248913 (99.8%) Active / Total Slabs (% used) : 878492 / 878500 (100.0%) Active / Total Caches (% used) : 108 / 227 (47.6%) Active / Total Size (% used) : 6911389.05K / 6913362.17K (100.0%) Minimum / Average / Maximum Object : 0.02K / 1.11K / 32768.00K OBJS ACTIVE USE OBJ SIZE SLABS OBJ/SLAB CACHE SIZE NAME 6038739 6038710 99% 1.12K 862677 7 6901416K lustre_inode_cache 49820 49806 99% 0.19K 2491 20 9964K dentry 48160 47939 99% 0.03K 430 112 1720K size-32 18236 18232 99% 0.99K 4559 4 18236K nfs_inode_cache 17040 16731 98% 0.12K 568 30 2272K size-128 13806 13346 96% 0.06K 234 59 936K size-64 7832 7790 99% 0.09K 178 44 712K sysfs_dir_cache 7329 7309 99% 0.57K 1047 7 4188K inode_cache 6440 6276 97% 0.19K 322 20 1288K size-192 5159 2745 53% 0.05K 67 77 268K anon_vma_chain 3976 3761 94% 0.50K 497 8 1988K size-512 Here you can see the client nodes are pegged due to swapper running constantly due to the memory pressure on the client. The lustre_inode_cache is huge.

            Here is the perf data I gathered on one of the MDS being used:

            Samples: 136K of event 'cycles', Event count (approx.): 45672465691
            62.57% ossec-syscheckd ossec-syscheckd [.] 0x0000000000027003
            + 3.20% init [kernel.kallsyms] [k] intel_idle
            + 1.57% swapper [kernel.kallsyms] [k] intel_idle
            + 0.88% ossec-syscheckd libc-2.12.so [.] memcpy
            + 0.78% ossec-syscheckd [kernel.kallsyms] [k] native_flush_tlb_global
            + 0.67% ossec-syscheckd [kernel.kallsyms] [k] copy_user_generic_string
            + 0.61% init [kernel.kallsyms] [k] poll_idle
            + 0.36% init [kernel.kallsyms] [k] rb_erase
            + 0.33% swapper [kernel.kallsyms] [k] _spin_unlock_irqrestore
            + 0.24% init [kernel.kallsyms] [k] _spin_unlock_irqrestore
            + 0.22% init [kernel.kallsyms] [k] __hrtimer_start_range_ns
            + 0.22% ossec-syscheckd [kernel.kallsyms] [k] clear_page_c
            + 0.21% swapper [kernel.kallsyms] [k] rb_erase
            + 0.21% ossec-syscheckd libc-2.12.so [.] vfprintf
            + 0.21% ossec-syscheckd [kernel.kallsyms] [k] page_fault
            + 0.18% ossec-syscheckd [kernel.kallsyms] [k] _spin_lock
            + 0.16% ossec-syscheckd [kernel.kallsyms] [k] file_read_actor
            + 0.15% swapper [kernel.kallsyms] [k] __remove_hrtimer
            + 0.15% ossec-syscheckd [kernel.kallsyms] [k] rpcauth_lookup_credcache
            + 0.14% ossec-syscheckd [kernel.kallsyms] [k] __change_page_attr_set_clr
            + 0.14% swapper [kernel.kallsyms] [k] __hrtimer_start_range_ns
            + 0.13% init [kernel.kallsyms] [k] schedule
            + 0.13% ossec-syscheckd [kernel.kallsyms] [k] lookup_address
            + 0.13% ossec-syscheckd [kernel.kallsyms] [k] __alloc_pages_nodemask
            + 0.12% init [kernel.kallsyms] [k] tick_nohz_stop_sched_tick
            + 0.11% kiblnd_sd_00_00 [kernel.kallsyms] [k] find_busiest_group
            + 0.11% ossec-syscheckd [kernel.kallsyms] [k] kmem_cache_alloc
            + 0.11% swapper [kernel.kallsyms] [k] poll_idle
            + 0.10% init [kernel.kallsyms] [k] cpuidle_idle_call
            + 0.10% ossec-syscheckd [kernel.kallsyms] [k] free_hot_cold_page

            and the slab top gives:

            Active / Total Objects (% used) : 8211619 / 11280489 (72.8%)
            Active / Total Slabs (% used) : 511008 / 511020 (100.0%)
            Active / Total Caches (% used) : 127 / 279 (45.5%)
            Active / Total Size (% used) : 1746332.12K / 2151220.29K (81.2%)
            Minimum / Average / Maximum Object : 0.02K / 0.19K / 4096.00K

            OBJS ACTIVE USE OBJ SIZE SLABS OBJ/SLAB CACHE SIZE NAME
            5973206 5972436 99% 0.10K 161438 37 645752K buffer_head
            1255968 255927 20% 0.12K 39249 32 156996K lod_obj
            1255968 255927 20% 0.08K 26166 48 104664K mdd_obj
            1255843 255927 20% 0.20K 66097 19 264388K mdt_obj
            281643 281643 100% 1.02K 93881 3 375524K ldiskfs_inode_cache
            255892 255853 99% 0.20K 13468 19 53872K osp_obj
            219184 174975 79% 0.03K 1957 112 7828K size-32
            175761 173927 98% 0.06K 2979 59 11916K size-64
            156680 155264 99% 0.19K 7834 20 31336K dentry
            147532 147478 99% 0.55K 21076 7 84304K radix_tree_node
            110262 110257 99% 1.02K 36754 3 147016K nfs_inode_cache
            22914 22876 99% 0.64K 3819 6 15276K proc_inode_cache

            From this the MDS doesn't look to have too heavy of a burden. Its not cpu pegged nor no memory exhaustion.

            simmonsja James A Simmons added a comment - Here is the perf data I gathered on one of the MDS being used: Samples: 136K of event 'cycles', Event count (approx.): 45672465691 62.57% ossec-syscheckd ossec-syscheckd [.] 0x0000000000027003 + 3.20% init [kernel.kallsyms] [k] intel_idle + 1.57% swapper [kernel.kallsyms] [k] intel_idle + 0.88% ossec-syscheckd libc-2.12.so [.] memcpy + 0.78% ossec-syscheckd [kernel.kallsyms] [k] native_flush_tlb_global + 0.67% ossec-syscheckd [kernel.kallsyms] [k] copy_user_generic_string + 0.61% init [kernel.kallsyms] [k] poll_idle + 0.36% init [kernel.kallsyms] [k] rb_erase + 0.33% swapper [kernel.kallsyms] [k] _spin_unlock_irqrestore + 0.24% init [kernel.kallsyms] [k] _spin_unlock_irqrestore + 0.22% init [kernel.kallsyms] [k] __hrtimer_start_range_ns + 0.22% ossec-syscheckd [kernel.kallsyms] [k] clear_page_c + 0.21% swapper [kernel.kallsyms] [k] rb_erase + 0.21% ossec-syscheckd libc-2.12.so [.] vfprintf + 0.21% ossec-syscheckd [kernel.kallsyms] [k] page_fault + 0.18% ossec-syscheckd [kernel.kallsyms] [k] _spin_lock + 0.16% ossec-syscheckd [kernel.kallsyms] [k] file_read_actor + 0.15% swapper [kernel.kallsyms] [k] __remove_hrtimer + 0.15% ossec-syscheckd [kernel.kallsyms] [k] rpcauth_lookup_credcache + 0.14% ossec-syscheckd [kernel.kallsyms] [k] __change_page_attr_set_clr + 0.14% swapper [kernel.kallsyms] [k] __hrtimer_start_range_ns + 0.13% init [kernel.kallsyms] [k] schedule + 0.13% ossec-syscheckd [kernel.kallsyms] [k] lookup_address + 0.13% ossec-syscheckd [kernel.kallsyms] [k] __alloc_pages_nodemask + 0.12% init [kernel.kallsyms] [k] tick_nohz_stop_sched_tick + 0.11% kiblnd_sd_00_00 [kernel.kallsyms] [k] find_busiest_group + 0.11% ossec-syscheckd [kernel.kallsyms] [k] kmem_cache_alloc + 0.11% swapper [kernel.kallsyms] [k] poll_idle + 0.10% init [kernel.kallsyms] [k] cpuidle_idle_call + 0.10% ossec-syscheckd [kernel.kallsyms] [k] free_hot_cold_page and the slab top gives: Active / Total Objects (% used) : 8211619 / 11280489 (72.8%) Active / Total Slabs (% used) : 511008 / 511020 (100.0%) Active / Total Caches (% used) : 127 / 279 (45.5%) Active / Total Size (% used) : 1746332.12K / 2151220.29K (81.2%) Minimum / Average / Maximum Object : 0.02K / 0.19K / 4096.00K OBJS ACTIVE USE OBJ SIZE SLABS OBJ/SLAB CACHE SIZE NAME 5973206 5972436 99% 0.10K 161438 37 645752K buffer_head 1255968 255927 20% 0.12K 39249 32 156996K lod_obj 1255968 255927 20% 0.08K 26166 48 104664K mdd_obj 1255843 255927 20% 0.20K 66097 19 264388K mdt_obj 281643 281643 100% 1.02K 93881 3 375524K ldiskfs_inode_cache 255892 255853 99% 0.20K 13468 19 53872K osp_obj 219184 174975 79% 0.03K 1957 112 7828K size-32 175761 173927 98% 0.06K 2979 59 11916K size-64 156680 155264 99% 0.19K 7834 20 31336K dentry 147532 147478 99% 0.55K 21076 7 84304K radix_tree_node 110262 110257 99% 1.02K 36754 3 147016K nfs_inode_cache 22914 22876 99% 0.64K 3819 6 15276K proc_inode_cache From this the MDS doesn't look to have too heavy of a burden. Its not cpu pegged nor no memory exhaustion.
            Sorry but I was wrong about performance fixes.
            

            So you mean "seeing much better performance" is not correct? will you redo the test? Actually I hope you can use Oprofile to profile MDS, so I can see which function or lock is being hit most, then know where is the bottleneck for this load. Thanks.

            di.wang Di Wang (Inactive) added a comment - Sorry but I was wrong about performance fixes. So you mean "seeing much better performance" is not correct? will you redo the test? Actually I hope you can use Oprofile to profile MDS, so I can see which function or lock is being hit most, then know where is the bottleneck for this load. Thanks.
            simmonsja James A Simmons added a comment - - edited

            Sorry but I was wrong about performance fixes. My script had a error in it where the default stripe was 1 for mdtest. I did do some profiling and I'm not seeing anything hogging cycles. What I did see is this with slab top on my client:

            Active / Total Objects (% used) : 549437 / 559744 (98.2%)
            Active / Total Slabs (% used) : 67767 / 67768 (100.0%)
            Active / Total Caches (% used) : 108 / 227 (47.6%)
            Active / Total Size (% used) : 532288.63K / 534120.31K (99.7%)
            Minimum / Average / Maximum Object : 0.02K / 0.95K / 32768.00K

            372512 372485 99% 1.12K 53216 7 425728K lustre_inode_cache
            41552 41431 99% 0.03K 371 112 1484K size-32
            38600 38575 99% 0.19K 1930 20 7720K dentry
            15744 15740 99% 0.99K 3936 4 15744K nfs_inode_cache
            14400 14349 99% 0.12K 480 30 1920K size-128
            13098 12493 95% 0.06K 222 59 888K size-64

            simmonsja James A Simmons added a comment - - edited Sorry but I was wrong about performance fixes. My script had a error in it where the default stripe was 1 for mdtest. I did do some profiling and I'm not seeing anything hogging cycles. What I did see is this with slab top on my client: Active / Total Objects (% used) : 549437 / 559744 (98.2%) Active / Total Slabs (% used) : 67767 / 67768 (100.0%) Active / Total Caches (% used) : 108 / 227 (47.6%) Active / Total Size (% used) : 532288.63K / 534120.31K (99.7%) Minimum / Average / Maximum Object : 0.02K / 0.95K / 32768.00K 372512 372485 99% 1.12K 53216 7 425728K lustre_inode_cache 41552 41431 99% 0.03K 371 112 1484K size-32 38600 38575 99% 0.19K 1930 20 7720K dentry 15744 15740 99% 0.99K 3936 4 15744K nfs_inode_cache 14400 14349 99% 0.12K 480 30 1920K size-128 13098 12493 95% 0.06K 222 59 888K size-64

            I have some good news and some bad news with my testing with perf installed. The good news is I'm seeing much better performance so far with large MDS stripe count. I will start collecting new data soon and post it here. The bad news is when creating one million plus files I'm seeing constant client eviction and reconnects due to time outs from the OSS. I will open a separate ticket for that.

            simmonsja James A Simmons added a comment - I have some good news and some bad news with my testing with perf installed. The good news is I'm seeing much better performance so far with large MDS stripe count. I will start collecting new data soon and post it here. The bad news is when creating one million plus files I'm seeing constant client eviction and reconnects due to time outs from the OSS. I will open a separate ticket for that.

            We are in the process of installing perf on our test systems to analysis what is going on. I should have something next week.

            simmonsja James A Simmons added a comment - We are in the process of installing perf on our test systems to analysis what is going on. I should have something next week.

            People

              di.wang Di Wang (Inactive)
              simmonsja James A Simmons
              Votes:
              0 Vote for this issue
              Watchers:
              14 Start watching this issue

              Dates

                Created:
                Updated:
                Resolved: