Uploaded image for project: 'Lustre'
  1. Lustre
  2. LU-15742

lockup in LNetMDUnlink during filesystem migration

Details

    • Bug
    • Resolution: Unresolved
    • Critical
    • None
    • Lustre 2.12.8
    • TOSS 3.7-19 based
      RHEL kernel 3.10.0-1160.59.1
      lustre 2.12.8_6.llnl
    • 3
    • 9223372036854775807

    Description

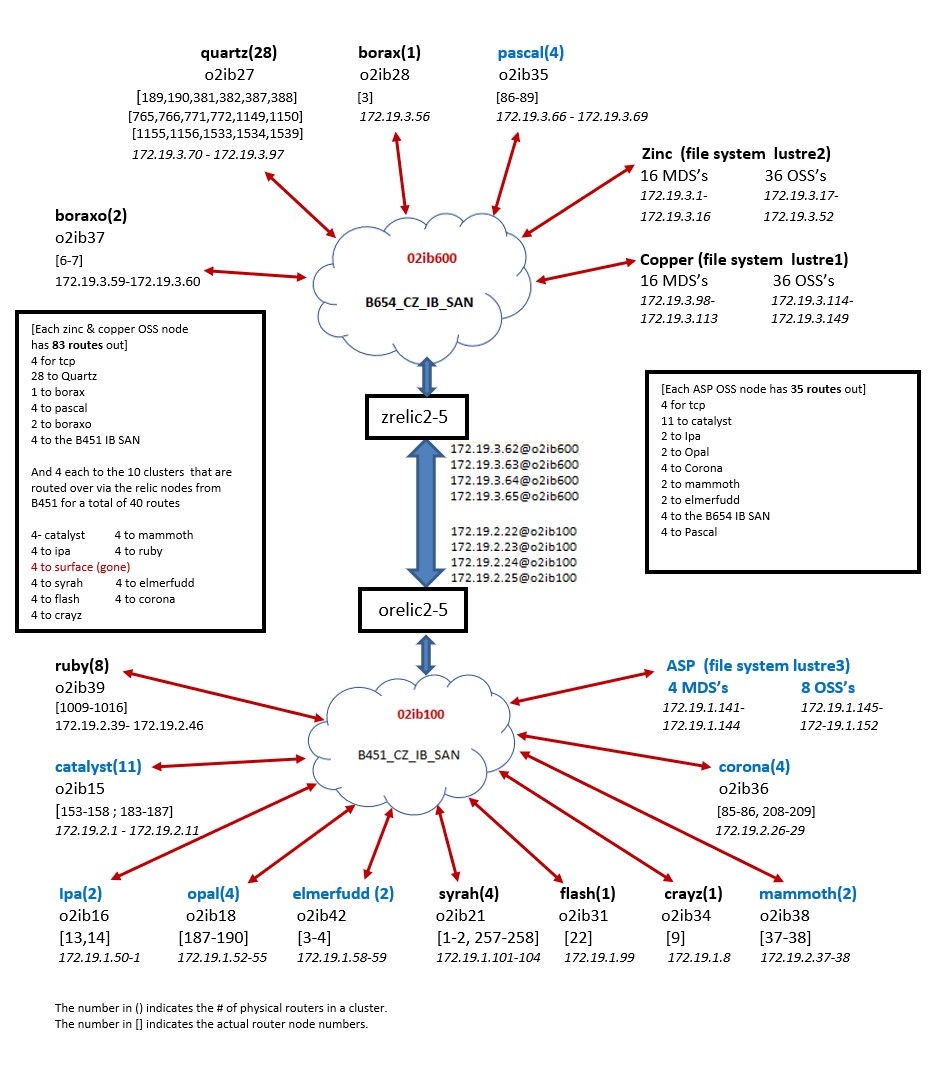
      We are having significant lnet issues that have caused us to disable lustre on one of our compute clusters (catalyst). We've had to turn off all of the router nodes in that cluster.

      When the routers for catalyst are on we see lots of errors and have connectivity problems on multiple clusters.

      This ticket may be useful to explain our lnet setup. https://jira.whamcloud.com/browse/LU-15234

      UPDATE: The initial issue have been resolved and our clusters and file systems are working and we don't have to turn off clusters and/or routers anymore. This ticket is now focused on the LNetMDUnlink() containing stack trace as a possible root cause. The OS update and underlying network issues we had seem to have been confounders.

      Related to https://jira.whamcloud.com/browse/LU-11895

      Attachments

        1. call-2022-4-19.tar.gz
          943 kB
        2. console.catalyst153
          1.96 MB
        3. console.orelic.tar.gz
          368 kB
        4. console.orelic2
          430 kB
        5. console.pascal128
          1.73 MB
        6. console.zrelic.tar.gz
          304 kB
        7. console.zrelic2
          485 kB
        8. lustre_network_updated.jpg
          lustre_network_updated.jpg
          202 kB
        9. opensm.orelic.log.gz
          132 kB
        10. opensm.zrelic.log.gz
          194 kB
        11. pascal128-vmcore-dmesg.txt
          772 kB
        12. pfstest-nodes.tar.gz
          7.51 MB

        Activity

          [LU-15742] lockup in LNetMDUnlink during filesystem migration
          ofaaland Olaf Faaland added a comment -

          Limiting lru_size worked around the issue successfully. Gian removed topllnl.

          Gian is working on a reproducer and a debug patch that checks for unintended loops in the hash chains being traversed by lnet_res_lh_lookup(), and determines the length of those chains if no loop is found.

          Once we have more information we'll update this ticket.

          ofaaland Olaf Faaland added a comment - Limiting lru_size worked around the issue successfully. Gian removed topllnl. Gian is working on a reproducer and a debug patch that checks for unintended loops in the hash chains being traversed by lnet_res_lh_lookup(), and determines the length of those chains if no loop is found. Once we have more information we'll update this ticket.

          After reviewing the related tickets and discussing with Amir, there's some things we can try.

          The previous tickets showed that the md lists were growing so much that it eventually caused issues when looking through the has in LNetMDUnlink

          1) If the number of CPTs can be increased on the client, doing so may be able to help avoid collisions

          2) As per Andreas' comment in LU-11092: "Another option would be to set a limit on the number of locks on the client and increase the max age to something better like 10 minutes, like lctl set_param ldlm.namespaces..lru_size=100000 ldlm.namespaces..lru_max_age=600000 or similar. ". I'm not sure we have the same issue here as in LU-11092 as this appears to be beyond LNet. Perhaps adilger  can comment if it is relevant.

          3) In another instance, similar problem was worked around by a combination of 
          ldlm.namespaces.*.lru_max_age=300s
          llite.*.inode_cache=0
          which may be not good for the client performance, but prevented it from crashing.

          Thanks,

          Serguei.

          ssmirnov Serguei Smirnov added a comment - After reviewing the related tickets and discussing with Amir, there's some things we can try. The previous tickets showed that the md lists were growing so much that it eventually caused issues when looking through the has in LNetMDUnlink 1) If the number of CPTs can be increased on the client, doing so may be able to help avoid collisions 2) As per Andreas' comment in LU-11092 : "Another option would be to set a limit on the number of locks on the client and increase the max age to something better like 10 minutes, like lctl set_param ldlm.namespaces. .lru_size=100000 ldlm.namespaces. .lru_max_age=600000 or similar. ".  I'm not sure we have the same issue here as in LU-11092 as this appears to be beyond LNet. Perhaps adilger   can comment if it is relevant. 3) In another instance, similar problem was worked around by a combination of  ldlm.namespaces.*.lru_max_age=300s llite.*.inode_cache=0 which may be not good for the client performance, but prevented it from crashing. Thanks, Serguei.

          The stack traces from the logs look very similar those from https://jira.whamcloud.com/browse/LU-11100 and several duplicate linked bugs.

          There was a comment in LU-11100 asking for additional information about who was holding the lock.  According to the NMI watchdog the holder appears to be executing the list_for_each_entry loop in LNetMDUnlink() -> lnet_handle2md() -> lnet_res_lh_lookup().  We observed this in the stack traces from multiple clients which hit the issue.

          struct lnet_libhandle *
          lnet_res_lh_lookup(struct lnet_res_container *rec, __u64 cookie)
          {
                  ...
          
                  list_for_each_entry(lh, head, lh_hash_chain) {
                          if (lh->lh_cookie == cookie)
                                  return lh;
                  }        return NULL;
          }


          [1650641425.080626] NMI watchdog: BUG: soft lockup - CPU#7 stuck for 23s! [ptlrpcd_00_34:17033]
          [1650641425.212628] CPU: 7 PID: 17033 Comm: ptlrpcd_00_34 Kdump: loaded Tainted: P           OEL ------------ T 3.10.0-1160.53.1.1chaos.ch6.x86_64 #1
          [1650641425.225628] Hardware name: Penguin Computing Relion X1904GT/MG20-OP0-ZB, BIOS R04 07/31/2017 
          [1650641425.233628] task: ffff8f643be51080 ti: ffff8f641a7e4000 task.ti: ffff8f641a7e4000
          [1650641425.241628] RIP: 0010:[<ffffffffc0adf288>]  [<ffffffffc0adf288>] lnet_res_lh_lookup+0x48/0x70 [lnet]
          [1650641425.251629] RSP: 0018:ffff8f641a7e7ba0  EFLAGS: 00000206
          [1650641425.257629] RAX: 0000000000000000 RBX: ffffffffffffff10 RCX: ffff9dc719aa5cc0
          [1650641425.264629] RDX: ffff8f6327022340 RSI: 000000001ba3d665 RDI: ffff8f64359bff40
          [1650641425.272629] RBP: ffff8f641a7e7ba0 R08: ffff8f443f5db8c0 R09: ffff8f443f85b8c0
          [1650641425.279629] R10: 0000000000000000 R11: 000000000000000f R12: 0000000000090001
          [1650641425.287629] R13: ffff8f443f45b8c0 R14: 0000000000390000 R15: 0000000000000000
          [1650641425.294629] FS:  0000000000000000(0000) GS:ffff8f443f5c0000(0000) knlGS:0000000000000000
          [1650641425.303629] CS:  0010 DS: 0000 ES: 0000 CR0: 0000000080050033
          [1650641425.309629] CR2: 00002aaab320f024 CR3: 0000003ff84b8000 CR4: 00000000003607e0
          [1650641425.317629] DR0: 0000000000000000 DR1: 0000000000000000 DR2: 0000000000000000
          [1650641425.324629] DR3: 0000000000000000 DR6: 00000000fffe0ff0 DR7: 0000000000000400
          [1650641425.332630] Call Trace:
          [1650641425.335630]  [<ffffffffc0af242c>] LNetMDUnlink+0xac/0x180 [lnet]
          [1650641425.341630]  [<ffffffffc3ce8dd6>] ptlrpc_unregister_reply+0x156/0x880 [ptlrpc]
          [1650641425.349630]  [<ffffffffc3cedc5e>] ptllnet_res_lh_lookuprpc_expire_one_request+0xfe/0x550 [ptlrpc]
          [1650641425.356630]  [<ffffffffc3cee15f>] ptlrpc_expired_set+0xaf/0x1a0 [ptlrpc]
          [1650641425.364630]  [<ffffffffc3d1f1bc>] ptlrpcd+0x29c/0x570 [ptlrpc]
          [1650641425.370630]  [<ffffffff994e1550>] ? wake_up_state+0x20/0x20
          [1650641425.376630]  [<ffffffffc3d1ef20>] ? ptlrpcd_check+0x5e0/0x5e0 [ptlrpc]
          [1650641425.383630]  [<ffffffff994cb221>] kthread+0xd1/0xe0
          [1650641425.388630]  [<ffffffff994cb150>] ? insert_kthread_work+0x40/0x40
          [1650641425.395630]  [<ffffffff99bc4fdd>] ret_from_fork_nospec_begin+0x7/0x21
          [1650641425.402630]  [<ffffffff994cb150>] ? insert_kthread_work+0x40/0x40


          behlendorf Brian Behlendorf added a comment - The stack traces from the logs look very similar those from https://jira.whamcloud.com/browse/LU-11100 and several duplicate linked bugs. There was a comment in LU-11100 asking for additional information about who was holding the lock.  According to the NMI watchdog the holder appears to be executing the list_for_each_entry loop in LNetMDUnlink() -> lnet_handle2md() -> lnet_res_lh_lookup() .  We observed this in the stack traces from multiple clients which hit the issue. struct lnet_libhandle * lnet_res_lh_lookup(struct lnet_res_container *rec, __u64 cookie) { ...       list_for_each_entry(lh, head, lh_hash_chain) {                 if (lh->lh_cookie == cookie)                         return lh;         }        return NULL; }   [1650641425.080626] NMI watchdog: BUG: soft lockup - CPU#7 stuck for 23s! [ptlrpcd_00_34:17033] [1650641425.212628] CPU: 7 PID: 17033 Comm: ptlrpcd_00_34 Kdump: loaded Tainted: P           OEL ------------ T 3.10.0-1160.53.1.1chaos.ch6.x86_64 #1 [1650641425.225628] Hardware name: Penguin Computing Relion X1904GT/MG20-OP0-ZB, BIOS R04 07/31/2017  [1650641425.233628] task: ffff8f643be51080 ti: ffff8f641a7e4000 task.ti: ffff8f641a7e4000 [1650641425.241628] RIP: 0010:[<ffffffffc0adf288>]  [<ffffffffc0adf288>] lnet_res_lh_lookup+0x48/0x70 [lnet] [1650641425.251629] RSP: 0018:ffff8f641a7e7ba0  EFLAGS: 00000206 [1650641425.257629] RAX: 0000000000000000 RBX: ffffffffffffff10 RCX: ffff9dc719aa5cc0 [1650641425.264629] RDX: ffff8f6327022340 RSI: 000000001ba3d665 RDI: ffff8f64359bff40 [1650641425.272629] RBP: ffff8f641a7e7ba0 R08: ffff8f443f5db8c0 R09: ffff8f443f85b8c0 [1650641425.279629] R10: 0000000000000000 R11: 000000000000000f R12: 0000000000090001 [1650641425.287629] R13: ffff8f443f45b8c0 R14: 0000000000390000 R15: 0000000000000000 [1650641425.294629] FS:  0000000000000000(0000) GS:ffff8f443f5c0000(0000) knlGS:0000000000000000 [1650641425.303629] CS:  0010 DS: 0000 ES: 0000 CR0: 0000000080050033 [1650641425.309629] CR2: 00002aaab320f024 CR3: 0000003ff84b8000 CR4: 00000000003607e0 [1650641425.317629] DR0: 0000000000000000 DR1: 0000000000000000 DR2: 0000000000000000 [1650641425.324629] DR3: 0000000000000000 DR6: 00000000fffe0ff0 DR7: 0000000000000400 [1650641425.332630] Call Trace: [1650641425.335630]  [<ffffffffc0af242c>] LNetMDUnlink+0xac/0x180 [lnet] [1650641425.341630]  [<ffffffffc3ce8dd6>] ptlrpc_unregister_reply+0x156/0x880 [ptlrpc] [1650641425.349630]  [<ffffffffc3cedc5e>] ptllnet_res_lh_lookuprpc_expire_one_request+0xfe/0x550 [ptlrpc] [1650641425.356630]  [<ffffffffc3cee15f>] ptlrpc_expired_set+0xaf/0x1a0 [ptlrpc] [1650641425.364630]  [<ffffffffc3d1f1bc>] ptlrpcd+0x29c/0x570 [ptlrpc] [1650641425.370630]  [<ffffffff994e1550>] ? wake_up_state+0x20/0x20 [1650641425.376630]  [<ffffffffc3d1ef20>] ? ptlrpcd_check+0x5e0/0x5e0 [ptlrpc] [1650641425.383630]  [<ffffffff994cb221>] kthread+0xd1/0xe0 [1650641425.388630]  [<ffffffff994cb150>] ? insert_kthread_work+0x40/0x40 [1650641425.395630]  [<ffffffff99bc4fdd>] ret_from_fork_nospec_begin+0x7/0x21 [1650641425.402630]  [<ffffffff994cb150>] ? insert_kthread_work+0x40/0x40  

          I've uploaded the console logs for a node that crashed during the call on 2022-04-22, pascal128,

          console.pascal128, pascal128-vmcore-dmesg.txt

          defazio Gian-Carlo Defazio added a comment - I've uploaded the console logs for a node that crashed during the call on 2022-04-22, pascal128, console.pascal128, pascal128-vmcore-dmesg.txt

          Are you available for another call today?

          defazio Gian-Carlo Defazio added a comment - Are you available for another call today?
          defazio Gian-Carlo Defazio added a comment - - edited

          The migration jobs are now being run on a different cluster, pascal.

          pascal is in the same building, B654, as the source and destination of the migrations (zinc to boa).

          We're still having issues with dropped messages and hangs and timeouts while the migrations are running. However, some migration jobs have been able to complete.

          The machines in B451 and the relic routers look good now that they're not involved in the migration.

          defazio Gian-Carlo Defazio added a comment - - edited The migration jobs are now being run on a different cluster, pascal. pascal is in the same building, B654, as the source and destination of the migrations (zinc to boa). We're still having issues with dropped messages and hangs and timeouts while the migrations are running. However, some migration jobs have been able to complete. The machines in B451 and the relic routers look good now that they're not involved in the migration.

          Cameron started running tests before I could.

          He ran an ior test with 1m block sizes and had no issues.

          He ran this ior command with no issues:

          ior -a POSIX -i 2 -b 32G -t 32k -F -C -e -z -o /p/asplustre2/harr1/OST0000/2204201032 -v -v -wWr -g -d 15

          We had a configuration change made to the 2 infiniband networks, B654_CZ_IB_SAN and B451_CZ_IB_SAN, which turned on hardware proxy mode. This was because hardware proxy mode had helped with another issue at our site on a different network.

          After hardware proxy mode was turned on, Cameron ran his migration jobs again. They caused issues, including the same errors we've seen previously on the relic routers and timeouts and disconnect for other clusters on the network.

          However, there are currently 3 migration jobs running our things look ok, and a few have been able to complete today.

          defazio Gian-Carlo Defazio added a comment - Cameron started running tests before I could. He ran an ior test with 1m block sizes and had no issues. He ran this ior command with no issues: ior -a POSIX -i 2 -b 32G -t 32k -F -C -e -z -o /p/asplustre2/harr1/OST0000/2204201032 -v -v -wWr -g -d 15 We had a configuration change made to the 2 infiniband networks, B654_CZ_IB_SAN and B451_CZ_IB_SAN, which turned on hardware proxy mode. This was because hardware proxy mode had helped with another issue at our site on a different network. After hardware proxy mode was turned on, Cameron ran his migration jobs again. They caused issues, including the same errors we've seen previously on the relic routers and timeouts and disconnect for other clusters on the network. However, there are currently 3 migration jobs running our things look ok, and a few have been able to complete today.
          defazio Gian-Carlo Defazio added a comment - - edited

          That might be the case, but it's hard to tell due to how Cameron's migration script works.

          Me:

          also, does your migration script tell you what phase of dsync you're in?
           That is, is it possible to see what phase you're in when things start 
          going bad? Serguei seems to think that things were fine during the walk 
          of zinc (FS "A"), which is kinda how it looked to me too yesterday.

          Cameron:

          That's not quite how the jobs work. The script first looks for the 
          heaviest users and prioritizes them at the top of the user list, then 
          goes through the user list and submits a new job for each
           user or group directory at the root of the file system. So there's 
          always a mix of jobs doing pure syncing and some doing walking

          You are correct that the tool we're using, dsync from Mpifileutils, scans (or walks) the source and destination before making changes to the destination.


          We have done IO testing on boa (FS "B"), although a lot of it was testing hardware and zfs performance, not lustre. However we've done lustre testing on it as well.

          I ran some IOR benchmarks on boa about 2 months ago after an OS update that changed the lustre version. However my tests used relatively large transfer sizes (2M) and block sizes (2G). I don't have any records of tests using small transfer and block sizes.

          We generally use catalyst for such tests and transfers because catalyst has a lot of spare cycles, and we did use it for some (and I believe most) of the initial performance testing on boa.

          I'll try some IOR runs with smaller sizes from catalyst.

          defazio Gian-Carlo Defazio added a comment - - edited That might be the case, but it's hard to tell due to how Cameron's migration script works. Me: also, does your migration script tell you what phase of dsync you're in? That is, is it possible to see what phase you're in when things start going bad? Serguei seems to think that things were fine during the walk of zinc (FS "A"), which is kinda how it looked to me too yesterday. Cameron: That's not quite how the jobs work. The script first looks for the heaviest users and prioritizes them at the top of the user list, then goes through the user list and submits a new job for each user or group directory at the root of the file system. So there's always a mix of jobs doing pure syncing and some doing walking You are correct that the tool we're using, dsync from Mpifileutils, scans (or walks) the source and destination before making changes to the destination.   We have done IO testing on boa (FS "B"), although a lot of it was testing hardware and zfs performance, not lustre. However we've done lustre testing on it as well. I ran some IOR benchmarks on boa about 2 months ago after an OS update that changed the lustre version. However my tests used relatively large transfer sizes (2M) and block sizes (2G). I don't have any records of tests using small transfer and block sizes. We generally use catalyst for such tests and transfers because catalyst has a lot of spare cycles, and we did use it for some (and I believe most) of the initial performance testing on boa. I'll try some IOR runs with smaller sizes from catalyst.

          These messages in orelic logs:

           Apr 19 15:22:28 orelic4 kernel: LNetError: 15918:0:(socklnd.c:1681:ksocknal_destroy_conn()) Completing partial receive from 12345-172.16.70.64@tcp[1], ip 172.16.70.64:988, with error, wanted: 224, left: 224, last alive is 0 secs ago

          are likely caused by connection getting destroyed while transferring data, but I haven't yet been able to establish why the connection is getting destroyed.

          My understanding is that

          • there are 2 FS involved and the migration job is first scanning FS "A" and then, after a while, applying changes to FS "B"
          • the issue starts happening when FS "B" starts getting accessed

          Is is correct? If so, have you tried any other (fio) tests with FS "B" (using same catalyst nodes)?

          ssmirnov Serguei Smirnov added a comment - These messages in orelic logs: Apr 19 15:22:28 orelic4 kernel: LNetError: 15918:0:(socklnd.c:1681:ksocknal_destroy_conn()) Completing partial receive from 12345-172.16.70.64@tcp[1], ip 172.16.70.64:988, with error, wanted: 224, left: 224, last alive is 0 secs ago are likely caused by connection getting destroyed while transferring data, but I haven't yet been able to establish why the connection is getting destroyed. My understanding is that there are 2 FS involved and the migration job is first scanning FS "A" and then, after a while, applying changes to FS "B" the issue starts happening when FS "B" starts getting accessed Is is correct? If so, have you tried any other (fio) tests with FS "B" (using same catalyst nodes)?

          I've added pfstest-nodes.tar.gz which has the console logs for slurm group pfstest on catalyst. These are the nodes used to perform the migration.

          defazio Gian-Carlo Defazio added a comment - I've added pfstest-nodes.tar.gz which has the console logs for slurm group pfstest on catalyst. These are the nodes used to perform the migration.

          People

            ssmirnov Serguei Smirnov
            defazio Gian-Carlo Defazio
            Votes:
            0 Vote for this issue
            Watchers:
            7 Start watching this issue

            Dates

              Created:
              Updated: