Uploaded image for project: 'Lustre'
  1. Lustre
  2. LU-15742

lockup in LNetMDUnlink during filesystem migration

Details

    • Bug
    • Resolution: Unresolved
    • Critical
    • None
    • Lustre 2.12.8
    • TOSS 3.7-19 based
      RHEL kernel 3.10.0-1160.59.1
      lustre 2.12.8_6.llnl
    • 3
    • 9223372036854775807

    Description

      We are having significant lnet issues that have caused us to disable lustre on one of our compute clusters (catalyst). We've had to turn off all of the router nodes in that cluster.

      When the routers for catalyst are on we see lots of errors and have connectivity problems on multiple clusters.

      This ticket may be useful to explain our lnet setup. https://jira.whamcloud.com/browse/LU-15234

      UPDATE: The initial issue have been resolved and our clusters and file systems are working and we don't have to turn off clusters and/or routers anymore. This ticket is now focused on the LNetMDUnlink() containing stack trace as a possible root cause. The OS update and underlying network issues we had seem to have been confounders.

      Related to https://jira.whamcloud.com/browse/LU-11895
      Attachments

        1. call-2022-4-19.tar.gz
          943 kB
        2. console.catalyst153
          1.96 MB
        3. console.orelic.tar.gz
          368 kB
        4. console.orelic2
          430 kB
        5. console.pascal128
          1.73 MB
        6. console.zrelic.tar.gz
          304 kB
        7. console.zrelic2
          485 kB
        8. lustre_network_updated.jpg
          lustre_network_updated.jpg
          202 kB
        9. opensm.orelic.log.gz
          132 kB
        10. opensm.zrelic.log.gz
          194 kB
        11. pascal128-vmcore-dmesg.txt
          772 kB
        12. pfstest-nodes.tar.gz
          7.51 MB

        Activity

          [LU-15742] lockup in LNetMDUnlink during filesystem migration
          defazio Gian-Carlo Defazio added a comment - - edited

          The migration jobs are now being run on a different cluster, pascal.

          pascal is in the same building, B654, as the source and destination of the migrations (zinc to boa).

          We're still having issues with dropped messages and hangs and timeouts while the migrations are running. However, some migration jobs have been able to complete.

          The machines in B451 and the relic routers look good now that they're not involved in the migration.

          defazio Gian-Carlo Defazio added a comment - - edited The migration jobs are now being run on a different cluster, pascal. pascal is in the same building, B654, as the source and destination of the migrations (zinc to boa). We're still having issues with dropped messages and hangs and timeouts while the migrations are running. However, some migration jobs have been able to complete. The machines in B451 and the relic routers look good now that they're not involved in the migration.

          Cameron started running tests before I could.

          He ran an ior test with 1m block sizes and had no issues.

          He ran this ior command with no issues:

          ior -a POSIX -i 2 -b 32G -t 32k -F -C -e -z -o /p/asplustre2/harr1/OST0000/2204201032 -v -v -wWr -g -d 15

          We had a configuration change made to the 2 infiniband networks, B654_CZ_IB_SAN and B451_CZ_IB_SAN, which turned on hardware proxy mode. This was because hardware proxy mode had helped with another issue at our site on a different network.

          After hardware proxy mode was turned on, Cameron ran his migration jobs again. They caused issues, including the same errors we've seen previously on the relic routers and timeouts and disconnect for other clusters on the network.

          However, there are currently 3 migration jobs running our things look ok, and a few have been able to complete today.

          defazio Gian-Carlo Defazio added a comment - Cameron started running tests before I could. He ran an ior test with 1m block sizes and had no issues. He ran this ior command with no issues: ior -a POSIX -i 2 -b 32G -t 32k -F -C -e -z -o /p/asplustre2/harr1/OST0000/2204201032 -v -v -wWr -g -d 15 We had a configuration change made to the 2 infiniband networks, B654_CZ_IB_SAN and B451_CZ_IB_SAN, which turned on hardware proxy mode. This was because hardware proxy mode had helped with another issue at our site on a different network. After hardware proxy mode was turned on, Cameron ran his migration jobs again. They caused issues, including the same errors we've seen previously on the relic routers and timeouts and disconnect for other clusters on the network. However, there are currently 3 migration jobs running our things look ok, and a few have been able to complete today.
          defazio Gian-Carlo Defazio added a comment - - edited

          That might be the case, but it's hard to tell due to how Cameron's migration script works.

          Me:

          also, does your migration script tell you what phase of dsync you're in?
           That is, is it possible to see what phase you're in when things start 
          going bad? Serguei seems to think that things were fine during the walk 
          of zinc (FS "A"), which is kinda how it looked to me too yesterday.

          Cameron:

          That's not quite how the jobs work. The script first looks for the 
          heaviest users and prioritizes them at the top of the user list, then 
          goes through the user list and submits a new job for each
           user or group directory at the root of the file system. So there's 
          always a mix of jobs doing pure syncing and some doing walking

          You are correct that the tool we're using, dsync from Mpifileutils, scans (or walks) the source and destination before making changes to the destination.


          We have done IO testing on boa (FS "B"), although a lot of it was testing hardware and zfs performance, not lustre. However we've done lustre testing on it as well.

          I ran some IOR benchmarks on boa about 2 months ago after an OS update that changed the lustre version. However my tests used relatively large transfer sizes (2M) and block sizes (2G). I don't have any records of tests using small transfer and block sizes.

          We generally use catalyst for such tests and transfers because catalyst has a lot of spare cycles, and we did use it for some (and I believe most) of the initial performance testing on boa.

          I'll try some IOR runs with smaller sizes from catalyst.

          defazio Gian-Carlo Defazio added a comment - - edited That might be the case, but it's hard to tell due to how Cameron's migration script works. Me: also, does your migration script tell you what phase of dsync you're in? That is, is it possible to see what phase you're in when things start going bad? Serguei seems to think that things were fine during the walk of zinc (FS "A"), which is kinda how it looked to me too yesterday. Cameron: That's not quite how the jobs work. The script first looks for the heaviest users and prioritizes them at the top of the user list, then goes through the user list and submits a new job for each user or group directory at the root of the file system. So there's always a mix of jobs doing pure syncing and some doing walking You are correct that the tool we're using, dsync from Mpifileutils, scans (or walks) the source and destination before making changes to the destination.   We have done IO testing on boa (FS "B"), although a lot of it was testing hardware and zfs performance, not lustre. However we've done lustre testing on it as well. I ran some IOR benchmarks on boa about 2 months ago after an OS update that changed the lustre version. However my tests used relatively large transfer sizes (2M) and block sizes (2G). I don't have any records of tests using small transfer and block sizes. We generally use catalyst for such tests and transfers because catalyst has a lot of spare cycles, and we did use it for some (and I believe most) of the initial performance testing on boa. I'll try some IOR runs with smaller sizes from catalyst.

          These messages in orelic logs:

           Apr 19 15:22:28 orelic4 kernel: LNetError: 15918:0:(socklnd.c:1681:ksocknal_destroy_conn()) Completing partial receive from 12345-172.16.70.64@tcp[1], ip 172.16.70.64:988, with error, wanted: 224, left: 224, last alive is 0 secs ago

          are likely caused by connection getting destroyed while transferring data, but I haven't yet been able to establish why the connection is getting destroyed.

          My understanding is that

          • there are 2 FS involved and the migration job is first scanning FS "A" and then, after a while, applying changes to FS "B"
          • the issue starts happening when FS "B" starts getting accessed

          Is is correct? If so, have you tried any other (fio) tests with FS "B" (using same catalyst nodes)?

          ssmirnov Serguei Smirnov added a comment - These messages in orelic logs: Apr 19 15:22:28 orelic4 kernel: LNetError: 15918:0:(socklnd.c:1681:ksocknal_destroy_conn()) Completing partial receive from 12345-172.16.70.64@tcp[1], ip 172.16.70.64:988, with error, wanted: 224, left: 224, last alive is 0 secs ago are likely caused by connection getting destroyed while transferring data, but I haven't yet been able to establish why the connection is getting destroyed. My understanding is that there are 2 FS involved and the migration job is first scanning FS "A" and then, after a while, applying changes to FS "B" the issue starts happening when FS "B" starts getting accessed Is is correct? If so, have you tried any other (fio) tests with FS "B" (using same catalyst nodes)?

          I've added pfstest-nodes.tar.gz which has the console logs for slurm group pfstest on catalyst. These are the nodes used to perform the migration.

          defazio Gian-Carlo Defazio added a comment - I've added pfstest-nodes.tar.gz which has the console logs for slurm group pfstest on catalyst. These are the nodes used to perform the migration.

          Gian-Carlo,

          Would it be possible to provide the dmsg from the compute node(s) used to run the migration job around the time of the issue? It looks like these may be useful after all.

          Thanks,

          Serguei.


          ssmirnov Serguei Smirnov added a comment - Gian-Carlo, Would it be possible to provide the dmsg from the compute node(s) used to run the migration job around the time of the issue? It looks like these may be useful after all. Thanks, Serguei.  

          I've added the lustre logs from today's call as call-2022-4-19.tar.gz

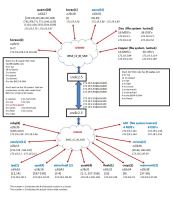
          boa isn't on the diagram yet, but it's in building 654, the same as zinc.

          defazio Gian-Carlo Defazio added a comment - I've added the lustre logs from today's call as call-2022-4-19.tar.gz boa isn't on the diagram yet, but it's in building 654, the same as zinc.

          The fix we had during the call (which was keeping catalyst154 off) didn't last . We're currently having issues even with all the catalyst routers off. It seems like we have underlying network issues on another compute cluster, quartz.

          As for the stack trace from LU-14282, Brian Behlendorf noticed that and we made sure that net was turned off. It's usually off on our systems.

          I've uploaded some logs for the relic clusters, including from the infiniband subnet manager. If you look at the network digram, the subnet managers for the 2 SANs are on orelic1 and zrelic1.

          Would you be able to do another call today?

          defazio Gian-Carlo Defazio added a comment - The fix we had during the call (which was keeping catalyst154 off) didn't last . We're currently having issues even with all the catalyst routers off. It seems like we have underlying network issues on another compute cluster, quartz. As for the stack trace from LU-14282 , Brian Behlendorf noticed that and we made sure that net was turned off. It's usually off on our systems. I've uploaded some logs for the relic clusters, including from the infiniband subnet manager. If you look at the network digram, the subnet managers for the 2 SANs are on orelic1 and zrelic1. Would you be able to do another call today?

          The problem described in this ticket didn't show up while bringing up "catalyst" routers during the call last week.

          The stack trace from above appears to be the same issue as LU-14282

          ssmirnov Serguei Smirnov added a comment - The problem described in this ticket didn't show up while bringing up "catalyst" routers during the call last week. The stack trace from above appears to be the same issue as LU-14282

          I've attached that network diagram from the call yesterday. This one is more up to date, but it doesn't have network types or bandwidths yet.

          defazio Gian-Carlo Defazio added a comment - I've attached that network diagram from the call yesterday. This one is more up to date, but it doesn't have network types or bandwidths yet.

          Here's the stacktrace from earlier that Cameron Harr pointed out

          [Thu Apr 14 15:33:23 2022] ------------[ cut here ]------------ [Thu Apr 14 15:33:23 2022] WARNING: CPU: 12 PID: 6263 at
          kernel/softirq.c:151 local_bh_enable_ip+0x82/0xb0 [Thu Apr 14 15:33:23 2022] Modules linked in: ko2iblnd(OE) lnet(OE)
          libcfs(OE) iTCO_wdt iTCO_vendor_support sb_edac intel_powerclamp coretemp intel_rapl iosf_mbi kvm irqbypass pcspkr rpcrdma ib_iser joydev lpc_ich zfs(POE) ioatdma zunicode(POE) zavl(POE) icp(POE) zcommon(POE)
          znvpair(POE) spl(OE) sg i2c_i801 ipmi_si ipmi_devintf ipmi_msghandler acpi_cpufreq sch_fq_codel binfmt_misc msr_safe(OE) ib_ipoib rdma_ucm ib_umad iw_cxgb4 rdma_cm iw_cm ib_cm iw_cxgb3 ip_tables nfsv3 nfs_acl
          rpcsec_gss_krb5 auth_rpcgss nfsv4 dns_resolver nfs lockd grace fscache
          overlay(T) ext4 mbcache jbd2 dm_service_time mlx4_ib ib_uverbs mlx4_en sd_mod crc_t10dif crct10dif_generic be2iscsi bnx2i cnic uio cxgb4i cxgb4 cxgb3i cxgb3 mdio libcxgbi libcxgb qla4xxx iscsi_boot_sysfs mgag200 drm_kms_helper 8021q syscopyarea sysfillrect sysimgblt [Thu Apr 14 15:33:23 2022]  garp fb_sys_fops crct10dif_pclmul crct10dif_common crc32_pclmul mrp stp crc32c_intel ib_qib llc ghash_clmulni_intel ahci ttm dm_multipath mlx4_core igb mpt2sas isci rdmavt aesni_intel libahci lrw drm libsas gf128mul dca glue_helper ablk_helper ptp raid_class ib_core cryptd libata pps_core devlink scsi_transport_sas drm_panel_orientation_quirks i2c_algo_bit wmi sunrpc dm_mirror dm_region_hash dm_log dm_mod iscsi_tcp libiscsi_tcp libiscsi scsi_transport_iscsi fuse [Thu Apr 14 15:33:23 2022] CPU: 12 PID: 6263 Comm: kworker/12:2H Kdump: 
          loaded Tainted: P           OE  ------------ T
          3.10.0-1160.59.1.1chaos.ch6.x86_64 #1
          [Thu Apr 14 15:33:23 2022] Hardware name: cray cray-2628-lr/S2600GZ, BIOS SE5C600.86B.02.06.0002.101320150901 10/13/2015 [Thu Apr 14 15:33:23 2022] Workqueue: rdmavt_cq send_complete [rdmavt] [Thu Apr 14 15:33:23 2022] Call Trace:
          [Thu Apr 14 15:33:23 2022]  [<ffffffff9f7b2d1c>] dump_stack+0x19/0x1b [Thu Apr 14 15:33:23 2022]  [<ffffffff9f09e168>] warn+0xd8/0x100 [Thu Apr 14 15:33:23 2022]  [<ffffffff9f09e2ad>]
          warn_slowpath_null+0x1d/0x20
          [Thu Apr 14 15:33:23 2022]  [<ffffffff9f0a76c2>]
          local_bh_enable_ip+0x82/0xb0
          [Thu Apr 14 15:33:23 2022]  [<ffffffff9f7bbbde>]
          _raw_spin_unlock_bh+0x1e/0x20
          [Thu Apr 14 15:33:23 2022]  [<ffffffffc0d873c5>]
          cfs_trace_unlock_tcd+0x65/0xb0 [libcfs]
          [Thu Apr 14 15:33:23 2022]  [<ffffffffc0d8de18>]
          libcfs_debug_vmsg2+0x728/0xbb0 [libcfs]
          [Thu Apr 14 15:33:23 2022]  [<ffffffff9f0e6078>] ? 
          enqueue_entity+0x78/0x80
          [Thu Apr 14 15:33:23 2022]  [<ffffffff9f0ed09f>] ? 
          enqueue_entity+0x2ef/0xc40
          [Thu Apr 14 15:33:23 2022]  [<ffffffffc0d8e2f7>]
          libcfs_debug_msg+0x57/0x80 [libcfs]
          [Thu Apr 14 15:33:23 2022]  [<ffffffffc0f0638a>]
          kiblnd_cq_completion+0x11a/0x160 [ko2iblnd] [Thu Apr 14 15:33:23 2022]  [<ffffffffc08e55ae>] send_complete+0x3e/0x60 [rdmavt] [Thu Apr 14 15:33:23 2022]  [<ffffffff9f0c2bef>]
          process_one_work+0x18f/0x4a0
          [Thu Apr 14 15:33:23 2022]  [<ffffffff9f0c39d6>] worker_thread+0x126/0x3e0 [Thu Apr 14 15:33:23 2022]  [<ffffffff9f0c38b0>] ? 
          rescuer_thread+0x430/0x430
          [Thu Apr 14 15:33:23 2022]  [<ffffffff9f0cb221>] kthread+0xd1/0xe0 [Thu Apr 14 15:33:23 2022]  [<ffffffff9f0cb150>] ? 
          insert_kthread_work+0x40/0x40
          [Thu Apr 14 15:33:23 2022]  [<ffffffff9f7c6ff7>]
          ret_from_fork_nospec_begin+0x21/0x21
          [Thu Apr 14 15:33:23 2022]  [<ffffffff9f0cb150>] ? 
          insert_kthread_work+0x40/0x40
          [Thu Apr 14 15:33:23 2022] ---[ end trace a92e008f43779f3c ]---
          defazio Gian-Carlo Defazio added a comment - Here's the stacktrace from earlier that Cameron Harr pointed out [Thu Apr 14 15:33:23 2022] ------------[ cut here ]------------ [Thu Apr 14 15:33:23 2022] WARNING: CPU: 12 PID: 6263 at kernel/softirq.c:151 local_bh_enable_ip+0x82/0xb0 [Thu Apr 14 15:33:23 2022] Modules linked in: ko2iblnd(OE) lnet(OE) libcfs(OE) iTCO_wdt iTCO_vendor_support sb_edac intel_powerclamp coretemp intel_rapl iosf_mbi kvm irqbypass pcspkr rpcrdma ib_iser joydev lpc_ich zfs(POE) ioatdma zunicode(POE) zavl(POE) icp(POE) zcommon(POE) znvpair(POE) spl(OE) sg i2c_i801 ipmi_si ipmi_devintf ipmi_msghandler acpi_cpufreq sch_fq_codel binfmt_misc msr_safe(OE) ib_ipoib rdma_ucm ib_umad iw_cxgb4 rdma_cm iw_cm ib_cm iw_cxgb3 ip_tables nfsv3 nfs_acl rpcsec_gss_krb5 auth_rpcgss nfsv4 dns_resolver nfs lockd grace fscache overlay(T) ext4 mbcache jbd2 dm_service_time mlx4_ib ib_uverbs mlx4_en sd_mod crc_t10dif crct10dif_generic be2iscsi bnx2i cnic uio cxgb4i cxgb4 cxgb3i cxgb3 mdio libcxgbi libcxgb qla4xxx iscsi_boot_sysfs mgag200 drm_kms_helper 8021q syscopyarea sysfillrect sysimgblt [Thu Apr 14 15:33:23 2022] garp fb_sys_fops crct10dif_pclmul crct10dif_common crc32_pclmul mrp stp crc32c_intel ib_qib llc ghash_clmulni_intel ahci ttm dm_multipath mlx4_core igb mpt2sas isci rdmavt aesni_intel libahci lrw drm libsas gf128mul dca glue_helper ablk_helper ptp raid_class ib_core cryptd libata pps_core devlink scsi_transport_sas drm_panel_orientation_quirks i2c_algo_bit wmi sunrpc dm_mirror dm_region_hash dm_log dm_mod iscsi_tcp libiscsi_tcp libiscsi scsi_transport_iscsi fuse [Thu Apr 14 15:33:23 2022] CPU: 12 PID: 6263 Comm: kworker/12:2H Kdump: loaded Tainted: P OE ------------ T 3.10.0-1160.59.1.1chaos.ch6.x86_64 #1 [Thu Apr 14 15:33:23 2022] Hardware name: cray cray-2628-lr/S2600GZ, BIOS SE5C600.86B.02.06.0002.101320150901 10/13/2015 [Thu Apr 14 15:33:23 2022] Workqueue: rdmavt_cq send_complete [rdmavt] [Thu Apr 14 15:33:23 2022] Call Trace: [Thu Apr 14 15:33:23 2022] [<ffffffff9f7b2d1c>] dump_stack+0x19/0x1b [Thu Apr 14 15:33:23 2022] [<ffffffff9f09e168>] warn+0xd8/0x100 [Thu Apr 14 15:33:23 2022] [<ffffffff9f09e2ad>] warn_slowpath_null+0x1d/0x20 [Thu Apr 14 15:33:23 2022] [<ffffffff9f0a76c2>] local_bh_enable_ip+0x82/0xb0 [Thu Apr 14 15:33:23 2022] [<ffffffff9f7bbbde>] _raw_spin_unlock_bh+0x1e/0x20 [Thu Apr 14 15:33:23 2022] [<ffffffffc0d873c5>] cfs_trace_unlock_tcd+0x65/0xb0 [libcfs] [Thu Apr 14 15:33:23 2022] [<ffffffffc0d8de18>] libcfs_debug_vmsg2+0x728/0xbb0 [libcfs] [Thu Apr 14 15:33:23 2022] [<ffffffff9f0e6078>] ? enqueue_entity+0x78/0x80 [Thu Apr 14 15:33:23 2022] [<ffffffff9f0ed09f>] ? enqueue_entity+0x2ef/0xc40 [Thu Apr 14 15:33:23 2022] [<ffffffffc0d8e2f7>] libcfs_debug_msg+0x57/0x80 [libcfs] [Thu Apr 14 15:33:23 2022] [<ffffffffc0f0638a>] kiblnd_cq_completion+0x11a/0x160 [ko2iblnd] [Thu Apr 14 15:33:23 2022] [<ffffffffc08e55ae>] send_complete+0x3e/0x60 [rdmavt] [Thu Apr 14 15:33:23 2022] [<ffffffff9f0c2bef>] process_one_work+0x18f/0x4a0 [Thu Apr 14 15:33:23 2022] [<ffffffff9f0c39d6>] worker_thread+0x126/0x3e0 [Thu Apr 14 15:33:23 2022] [<ffffffff9f0c38b0>] ? rescuer_thread+0x430/0x430 [Thu Apr 14 15:33:23 2022] [<ffffffff9f0cb221>] kthread+0xd1/0xe0 [Thu Apr 14 15:33:23 2022] [<ffffffff9f0cb150>] ? insert_kthread_work+0x40/0x40 [Thu Apr 14 15:33:23 2022] [<ffffffff9f7c6ff7>] ret_from_fork_nospec_begin+0x21/0x21 [Thu Apr 14 15:33:23 2022] [<ffffffff9f0cb150>] ? insert_kthread_work+0x40/0x40 [Thu Apr 14 15:33:23 2022] ---[ end trace a92e008f43779f3c ]---

          People

            ssmirnov Serguei Smirnov
            defazio Gian-Carlo Defazio
            Votes:
            0 Vote for this issue
            Watchers:
            7 Start watching this issue

            Dates

              Created:
              Updated: