-
Bug
-
Resolution: Fixed
-
 Major
Major
-
Lustre 2.4.3
-
None
-
Kernel: kernel-2.6.32-431.11.2.el6.x86_64 w/ patch for Lustre
Lustre: lustre-2.4.3-Bull.4.014.el6.20140426.x86_64
Filesystem: 150,000,000+ inodes, 5000+ clients
Robinhood: 2.5
-
3
-
15041
We are facing a performance issue when using robinhood in changelog mode on top
of Lustre 2.4.3.
The more the changelog size increase, the more time to clear the records increase.
The production has started on 2014/06/19, after a update from Lustre 2.1 to
Lustre 2.4. The robinhood service has been started on 2014/06/24 09:07:16.
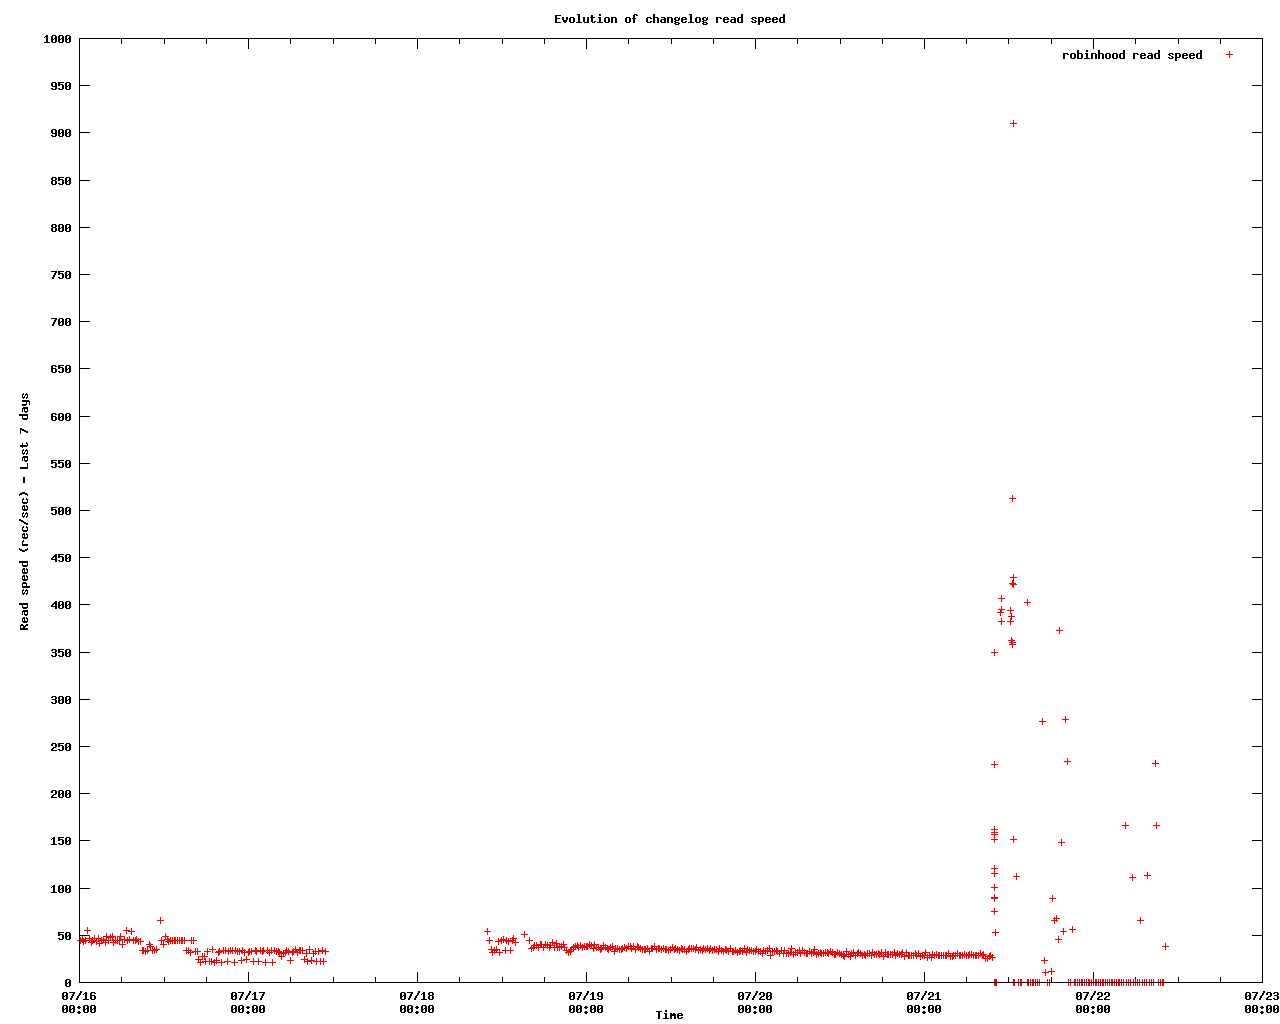
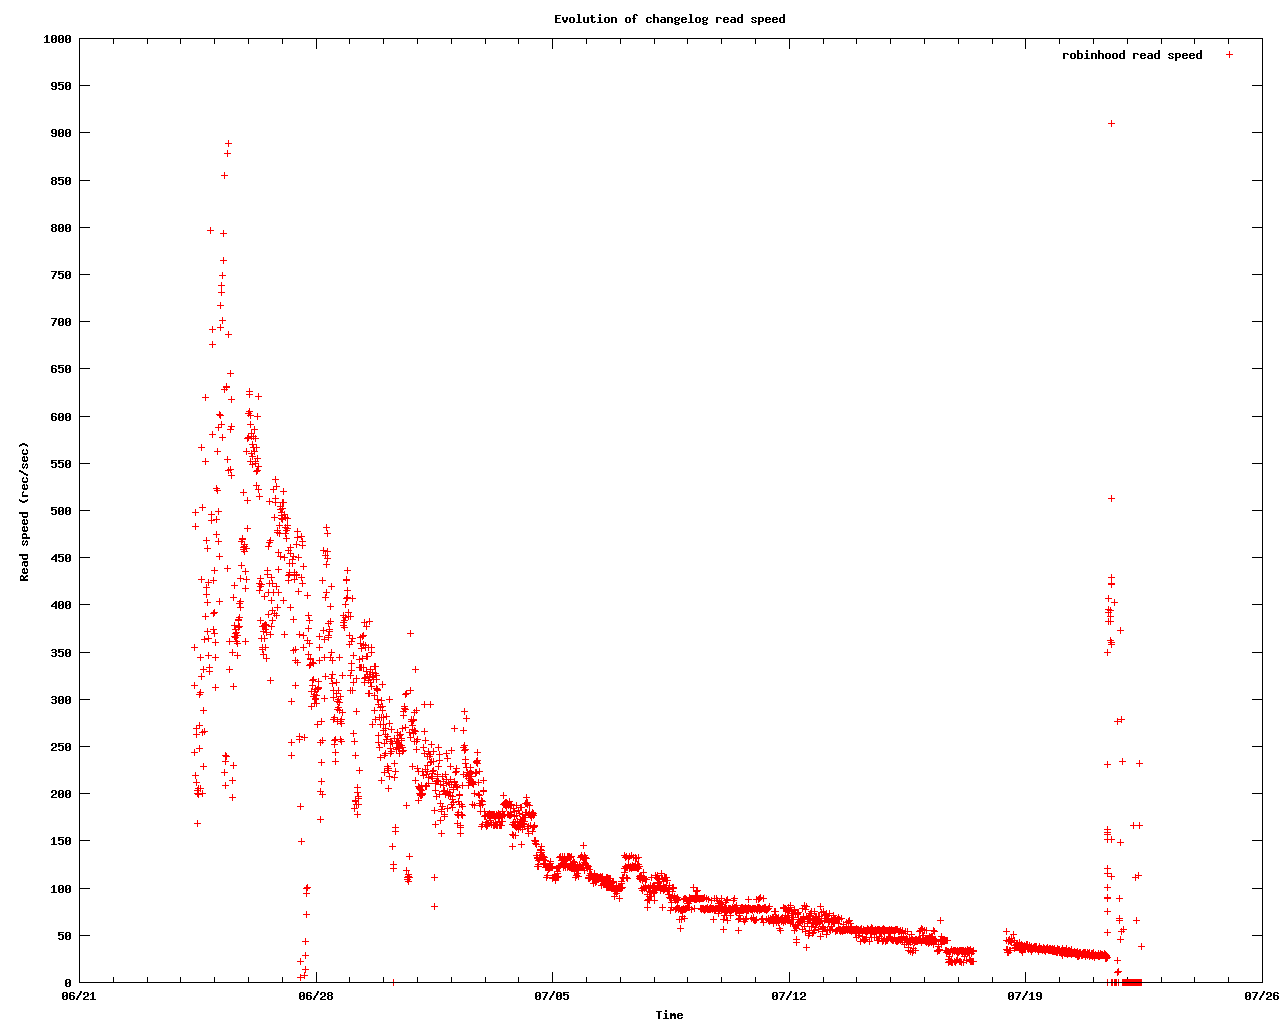
The evolution of the read speed is shown in figure robinhood-readspeed.png. The
read speed is the number of record processed per second by robinhood, kept in
its logfile. (see attached file robinhood.log.STATS)
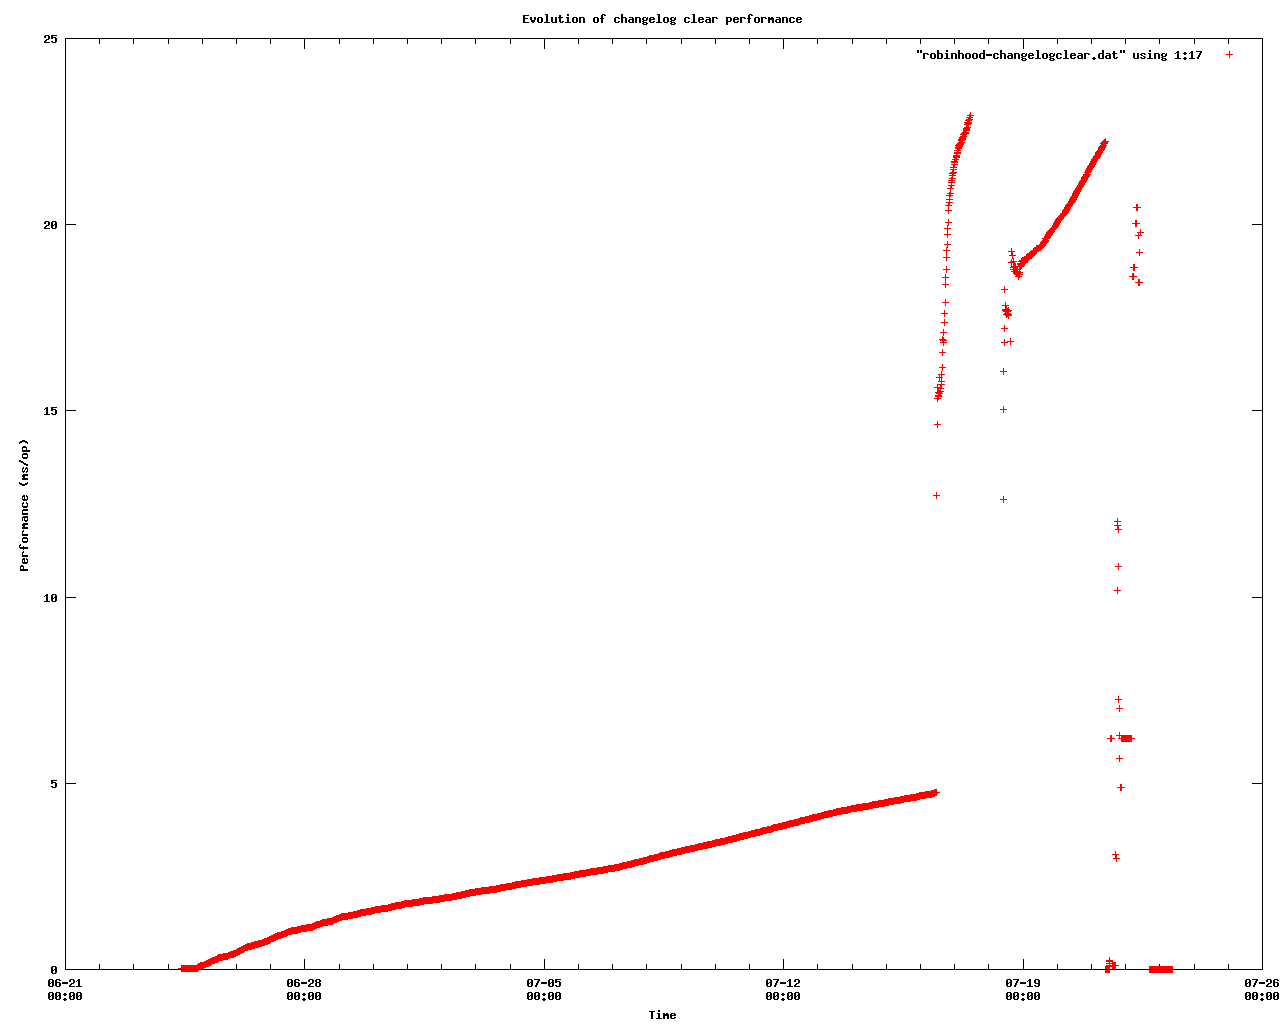
The performance of the changelog clear is also available in this logfile. This
performance is mesured in ms per operation. The evolution of the changelog
clear performance is shown in figure robinhood-changelogclear.png.
The service has been restarted on 2014/07/16 11:11:50, with no improvments.
As the customer was suspecting the performance of the mysql backend storage to
be the root cause of this issue, the Lustre client running robinhood has been
moved from a bullx S6030 (32 sockets, 64GB memory) to a bullx S6030 (32
sockets, 128GB memory) connected to a faster backend storage for storing the
mysql db on 2014/07/17. The service has been restarted on 2014/07/18 09:41:54
and several times since, until the reboot of the Lustre client on 2014/07/21
12:00:00. We then hit a lot of evictions due to ldlm callbacks timeout. We
stopped the robinhood service on 2014/07/22 10:14:14.
By looking at the changelog, we observed that the MDS was still clearing
records. It cleared records until 2014/07/22 20:00:00.
The MDS was clearing records with a rate of 30 records/sec.
In the meantime, by looking at the MDS, I find out that the kernel thread
mdt03_068 (PID 20076) is in charge of the changelog clear. This thread is
running on CPU 27.
The function llog_cat_id2handle() makes an heavy use of this CPU:
Samples: 27K of event 'cycles', Event count (approx.): 2347474354
 46.45% [obdclass] [k] llog_cat_id2handle
 37.66% [kernel] [k] _spin_lock_irqsave
  4.34% [kernel] [k] _spin_lock
  0.71% [kernel] [k] find_busiest_group
  0.32% [kernel] [k] _spin_unlock_irqrestore
  0.26% [ldiskfs] [k] 0x0000000000043778
  0.24% [lvfs] [k] lprocfs_counter_add
  0.16% [kernel] [k] schedule
  0.16% [mlx4_ib] [k] 0x0000000000000c34
  0.15% [kernel] [k] thread_return
  0.14% [kernel] [k] apic_timer_interrupt
  0.14% [obdclass] [k] class_handle2object
  0.12% [ko2iblnd] [k] kiblnd_find_peer_locked
  0.12% [kernel] [k] menu_select
  0.11% [kernel] [k] _spin_lock_irq
  0.11% [ko2iblnd] [k] kiblnd_scheduler
  0.11% [kernel] [k] find_next_bit
  0.10% [kernel] [k] fair_update_curr
  0.10% [kernel] [k] memcpy
  0.09% [kernel] [k] kfree
...
In the context of clearing records, the function seems to be called by
llog_cat_cancel_records(). I enabled the rpctrace debug on the mds. A sample of
the debug log is available in file debug.rpctrace.pid20076.
We still see the same rate of 30 rec/sec.
The bottleneck seems to be in this portion of code (lustre/obdclass/llog_cat.c):
155 int llog_cat_id2handle(const struct lu_env *env, struct llog_handle *cathandle,
156                struct llog_handle **res, struct llog_logid *logid)
157 {
158     struct llog_handle  *loghandle;
...
166     down_write(&cathandle->lgh_lock);
167     cfs_list_for_each_entry(loghandle, &cathandle->u.chd.chd_head,      <== bottleneck ?
168                 u.phd.phd_entry) {
169         struct llog_logid *cgl = &loghandle->lgh_id;
170
171         if (ostid_id(&cgl->lgl_oi) == ostid_id(&logid->lgl_oi) &&       ==> ostid_id:  /* extract OST objid from a wire ost_id (id/seq) pair */
172             ostid_seq(&cgl->lgl_oi) == ostid_seq(&logid->lgl_oi)) {     ==> ostid_seq: /* extract OST sequence (group) from a wire ost_id (id/seq) pair */
                                                                            ==> check if it is the same log object (id/seq)
173             if (cgl->lgl_ogen != logid->lgl_ogen) {
...
179             }
180             loghandle->u.phd.phd_cat_handle = cathandle;
181             up_write(&cathandle->lgh_lock);
182             GOTO(out, rc = 0);
...
212 out:
213     llog_handle_get(loghandle);
214     *res = loghandle;
215     return 0;
216 }
Finally, the robinhood has been restarted on 2014/07/22 16:46:19, but in scan
mode.
The changelog has not been deregistered yet, we are keeping it for testing
purposes. We plan to register a new changelog in order to restart robinhood in
changelog mode and see if we observe the same behavior.