Uploaded image for project: 'Lustre'
  1. Lustre
  2. LU-3321

2.x single thread/process throughput degraded from 1.8

Details

    • Bug
    • Resolution: Fixed
    • Blocker
    • Lustre 2.6.0
    • Lustre 2.4.0
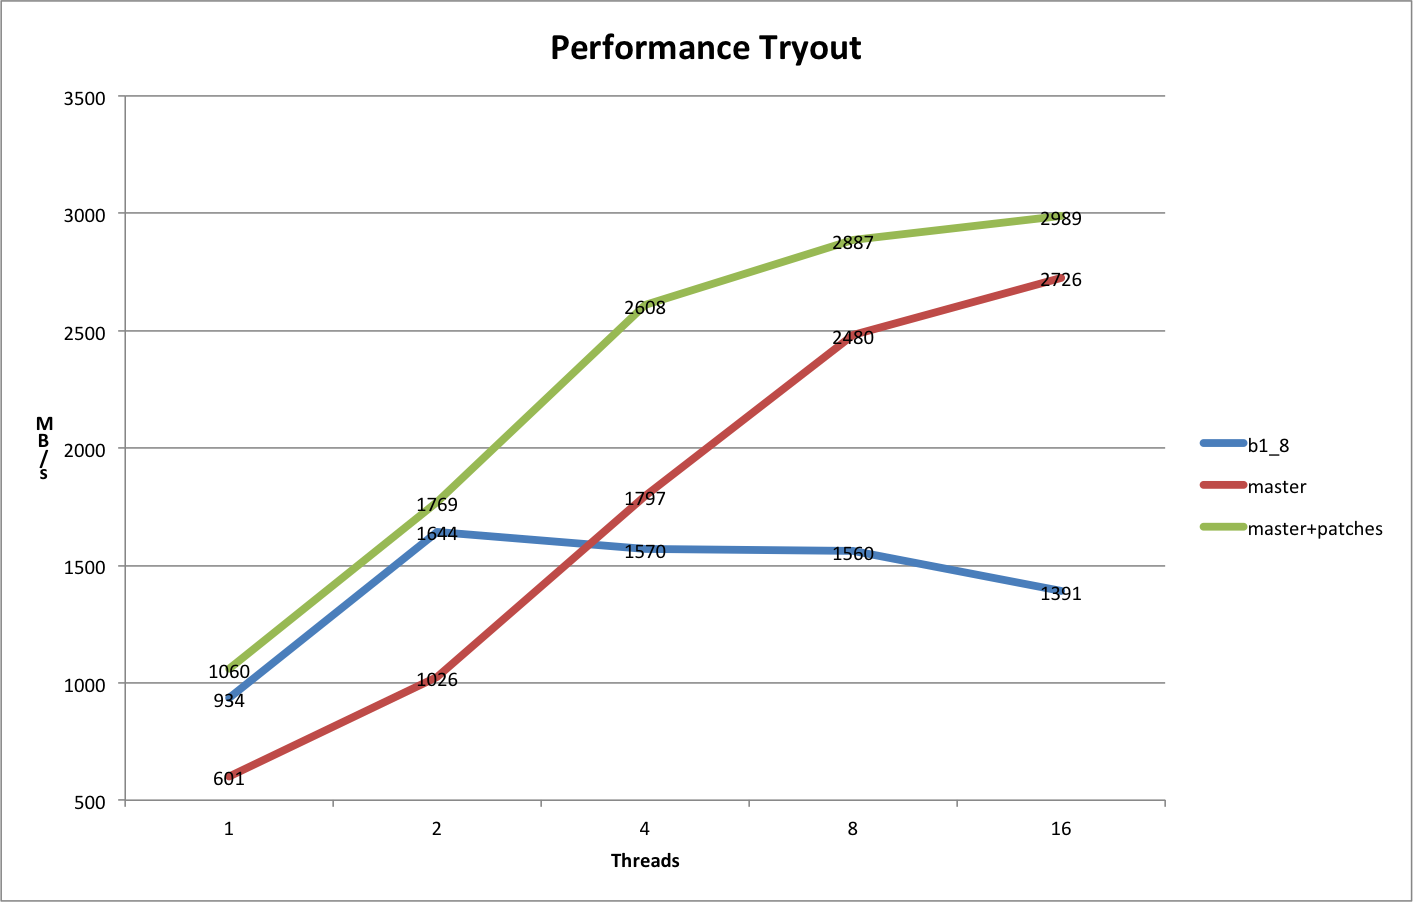
    • Tested on 2.3.64 and 1.8.9 clients with 4 OSS x 3 - 32 GB OST ramdisks
    • 3
    • 8259

    Description

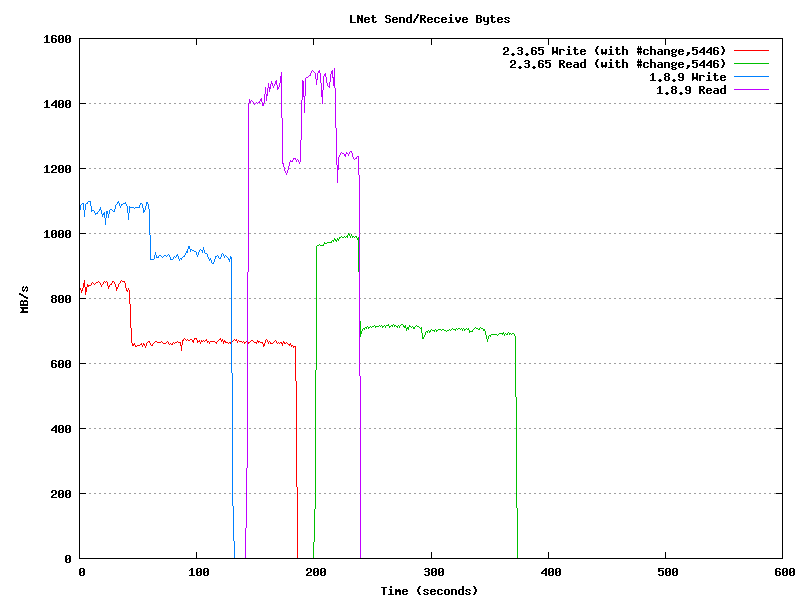
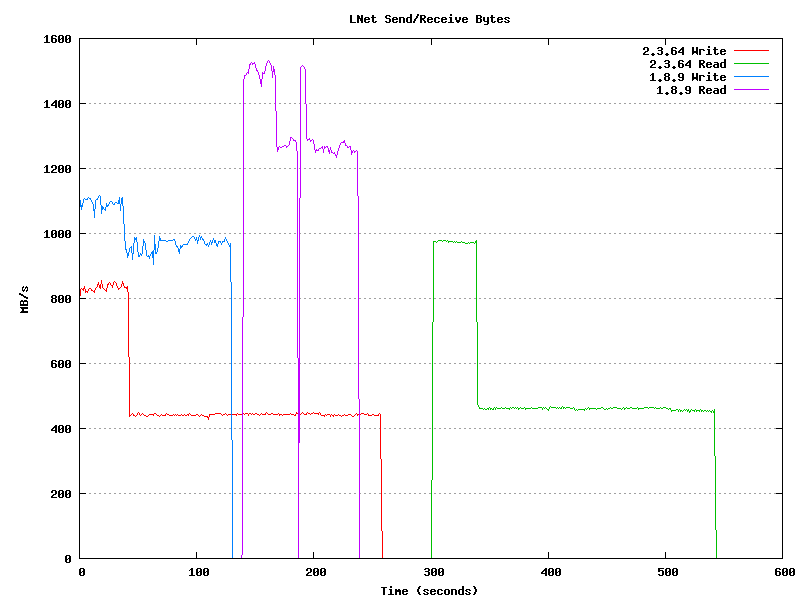
      Single thread/process throughput on tag 2.3.64 is degraded from 1.8.9 and significantly degraded when the client hits its caching limit (llite.*.max_cached_mb). Attached graph shows lnet stats sampled every second for a single dd writing 2 - 64 GB files followed by a dropping cache and reading the same two files. The tests were not done simultaenously but the graph has them starting from the same point. It also takes a significant amount of time to drop the cache on 2.3.64.

      Lustre 2.3.64
      Write (dd if=/dev/zero of=testfile bs=1M)
      68719476736 bytes (69 GB) copied, 110.459 s, 622 MB/s
      68719476736 bytes (69 GB) copied, 147.935 s, 465 MB/s

      Drop caches (echo 1 > /proc/sys/vm/drop_caches)
      real 0m43.075s

      Read (dd if=testfile of=/dev/null bs=1M)
      68719476736 bytes (69 GB) copied, 99.2963 s, 692 MB/s
      68719476736 bytes (69 GB) copied, 142.611 s, 482 MB/s

      Lustre 1.8.9
      Write (dd if=/dev/zero of=testfile bs=1M)
      68719476736 bytes (69 GB) copied, 63.3077 s, 1.1 GB/s
      68719476736 bytes (69 GB) copied, 67.4487 s, 1.0 GB/s

      Drop caches (echo 1 > /proc/sys/vm/drop_caches)
      real 0m9.189s

      Read (dd if=testfile of=/dev/null bs=1M)
      68719476736 bytes (69 GB) copied, 46.4591 s, 1.5 GB/s
      68719476736 bytes (69 GB) copied, 52.3635 s, 1.3 GB/s

      Attachments

        1. cpustat.scr
          0.5 kB
        2. dd_throughput_comparison_with_change_5446.png
          dd_throughput_comparison_with_change_5446.png
          7 kB
        3. dd_throughput_comparison.png
          dd_throughput_comparison.png
          6 kB
        4. lu-3321-singlethreadperf.tgz
          391 kB
        5. lu-3321-singlethreadperf2.tgz
          564 kB
        6. mcm8_wcd.png
          mcm8_wcd.png
          9 kB
        7. perf3.png
          perf3.png
          103 kB

        Issue Links

          Activity

            [LU-3321] 2.x single thread/process throughput degraded from 1.8
            [root@c01 ~]# lscpu 
            Architecture:          x86_64
            CPU op-mode(s):        32-bit, 64-bit
            Byte Order:            Little Endian
            CPU(s):                8
            On-line CPU(s) list:   0-7
            Thread(s) per core:    2
            Core(s) per socket:    4
            Socket(s):             1
            NUMA node(s):          1
            Vendor ID:             GenuineIntel
            CPU family:            6
            Model:                 44
            Stepping:              2
            CPU MHz:               1600.000
            BogoMIPS:              4800.65
            Virtualization:        VT-x
            L1d cache:             32K
            L1i cache:             32K
            L2 cache:              256K
            L3 cache:              12288K
            NUMA node0 CPU(s):     0-7
            
            [root@c01 ~]# cat /proc/cpuinfo 
            processor	: 0
            vendor_id	: GenuineIntel
            cpu family	: 6
            model		: 44
            model name	: Intel(R) Xeon(R) CPU           E5620  @ 2.40GHz
            stepping	: 2
            cpu MHz		: 1600.000
            cache size	: 12288 KB
            physical id	: 0
            siblings	: 8
            core id		: 0
            cpu cores	: 4
            apicid		: 0
            initial apicid	: 0
            fpu		: yes
            fpu_exception	: yes
            cpuid level	: 11
            wp		: yes
            flags		: fpu vme de pse tsc msr pae mce cx8 apic sep mtrr pge mca cmov pat pse36 clflush dts acpi mmx fxsr sse sse2 ss ht tm pbe syscall nx pdpe1gb rdtscp lm constant_tsc arch_perfmon pebs bts rep_good xtopology nonstop_tsc aperfmperf pni dtes64 monitor ds_cpl vmx smx est tm2 ssse3 cx16 xtpr pdcm pcid dca sse4_1 sse4_2 popcnt lahf_lm ida arat epb dts tpr_shadow vnmi flexpriority ept vpid
            bogomips	: 4800.65
            clflush size	: 64
            cache_alignment	: 64
            address sizes	: 40 bits physical, 48 bits virtual
            power management:
            
            jay Jinshan Xiong (Inactive) added a comment - [root@c01 ~]# lscpu Architecture: x86_64 CPU op-mode(s): 32-bit, 64-bit Byte Order: Little Endian CPU(s): 8 On-line CPU(s) list: 0-7 Thread(s) per core: 2 Core(s) per socket: 4 Socket(s): 1 NUMA node(s): 1 Vendor ID: GenuineIntel CPU family: 6 Model: 44 Stepping: 2 CPU MHz: 1600.000 BogoMIPS: 4800.65 Virtualization: VT-x L1d cache: 32K L1i cache: 32K L2 cache: 256K L3 cache: 12288K NUMA node0 CPU(s): 0-7 [root@c01 ~]# cat /proc/cpuinfo processor : 0 vendor_id : GenuineIntel cpu family : 6 model : 44 model name : Intel(R) Xeon(R) CPU E5620 @ 2.40GHz stepping : 2 cpu MHz : 1600.000 cache size : 12288 KB physical id : 0 siblings : 8 core id : 0 cpu cores : 4 apicid : 0 initial apicid : 0 fpu : yes fpu_exception : yes cpuid level : 11 wp : yes flags : fpu vme de pse tsc msr pae mce cx8 apic sep mtrr pge mca cmov pat pse36 clflush dts acpi mmx fxsr sse sse2 ss ht tm pbe syscall nx pdpe1gb rdtscp lm constant_tsc arch_perfmon pebs bts rep_good xtopology nonstop_tsc aperfmperf pni dtes64 monitor ds_cpl vmx smx est tm2 ssse3 cx16 xtpr pdcm pcid dca sse4_1 sse4_2 popcnt lahf_lm ida arat epb dts tpr_shadow vnmi flexpriority ept vpid bogomips : 4800.65 clflush size : 64 cache_alignment : 64 address sizes : 40 bits physical, 48 bits virtual power management:

            Jinshan,

            In attachment the script that generates the CPU usage graphs with gnuplot. File "filename" contains the data where each line has the following format:
            time user system idle iowait

            This can be obtained with vmstat command for global CPU usage, or from /proc/stat file for per-CPU usage.

            What model of CPU is present on OpenSFS cluster ?

            pichong Gregoire Pichon added a comment - Jinshan, In attachment the script that generates the CPU usage graphs with gnuplot. File "filename" contains the data where each line has the following format: time user system idle iowait This can be obtained with vmstat command for global CPU usage, or from /proc/stat file for per-CPU usage. What model of CPU is present on OpenSFS cluster ?
            paf Patrick Farrell (Inactive) added a comment - Just as a favor to anyone else interested, this is a complete list of patches landed against LU-3321 : http://review.whamcloud.com/#/c/7888 http://review.whamcloud.com/#/c/7890 http://review.whamcloud.com/#/c/7891 http://review.whamcloud.com/#/c/7892 http://review.whamcloud.com/#/c/8174 http://review.whamcloud.com/#/c/7893 http://review.whamcloud.com/#/c/7894 http://review.whamcloud.com/#/c/7895 http://review.whamcloud.com/#/c/8523 7889, listed in Jinshan's earlier list of patches, was abandoned.

            From the cpu stat, it clearly showed that the cpu usage is around 80% for single thread and single stripe write, this is why you can see a slight performance improvement with multiple striped file. CLIO is still CPU intensive and your CPU can only drive ~900MB/s IO on the client side. As a comparison, the CPU on OpenSFS cluster can drive ~1.2GB/s.

            Can you please provide me the test script you're using to collect data and generate diagram, therefore I can reproduce this on OpenSFS cluster?

            jay Jinshan Xiong (Inactive) added a comment - From the cpu stat, it clearly showed that the cpu usage is around 80% for single thread and single stripe write, this is why you can see a slight performance improvement with multiple striped file. CLIO is still CPU intensive and your CPU can only drive ~900MB/s IO on the client side. As a comparison, the CPU on OpenSFS cluster can drive ~1.2GB/s. Can you please provide me the test script you're using to collect data and generate diagram, therefore I can reproduce this on OpenSFS cluster?

            I agree with quota beeing the potential culprit. But why is it so expensive to check if user has quota enabled ? Even if it's done for each IO, single thread has no concurrency problem.

            The performance with a stripecount of 1 is: 720 MiB/s write and 896 MiB/s read (lustre 2.5.57).

            In attachment monitoring data for a run with stripecount of 1 (lu-3321-singlethreadperf2.tgz)

            All runs have been launched with /proc/sys/lnet/debug set to 0 on both client and server.

            Monitoring data for client CPU usage is in client/mo85/cpustat directory:

            • cpustat-global and cpustat-global.png give all cpus usage
            • cpustat-cpu0 cpustat-cpu0.png give CPU0 usage (IOR is bound to that core).

            Since IOR performance is close to OST device raw performance, using multiple stripes might help exceed this limit.

            pichong Gregoire Pichon added a comment - I agree with quota beeing the potential culprit. But why is it so expensive to check if user has quota enabled ? Even if it's done for each IO, single thread has no concurrency problem. The performance with a stripecount of 1 is: 720 MiB/s write and 896 MiB/s read (lustre 2.5.57). In attachment monitoring data for a run with stripecount of 1 (lu-3321-singlethreadperf2.tgz) All runs have been launched with /proc/sys/lnet/debug set to 0 on both client and server. Monitoring data for client CPU usage is in client/mo85/cpustat directory: cpustat-global and cpustat-global.png give all cpus usage cpustat-cpu0 cpustat-cpu0.png give CPU0 usage (IOR is bound to that core). Since IOR performance is close to OST device raw performance, using multiple stripes might help exceed this limit.

            For the different between root and normal user, I guess this is due to quota check. Though you may not enable quota for this normal user, it will still check if quota is enabled for this specific user for each IO.

            What's the write speed you can get by 1 stripe? Please be sure to disable debug log by `lctl set_param debug=0' on the client side. Also please monitor the CPU usage on the client side when writing a stripe file and multi-striped file specifically.

            In general, if CPU is the bottleneck on the client side, it won't help improve IO speed by adding more stripes.

            jay Jinshan Xiong (Inactive) added a comment - For the different between root and normal user, I guess this is due to quota check. Though you may not enable quota for this normal user, it will still check if quota is enabled for this specific user for each IO. What's the write speed you can get by 1 stripe? Please be sure to disable debug log by `lctl set_param debug=0' on the client side. Also please monitor the CPU usage on the client side when writing a stripe file and multi-striped file specifically. In general, if CPU is the bottleneck on the client side, it won't help improve IO speed by adding more stripes.

            in attachment the monitoring data from one of the lustre 2.5.57 run, as standard user

            pichong Gregoire Pichon added a comment - in attachment the monitoring data from one of the lustre 2.5.57 run, as standard user

            Hi Jinshan,

            Here are the results of the performance measurements I have done.

            Configuration
            Client is a node with 2 Ivybridge sockets (24 cores, 2.7GHz), 32GB memory, 1 FDR Infiniband adapter.
            OSS is a node with 2 Sandybridge sockets (16 cores, 2.2GHZ), 32GB memory, 1 FDR Infiniband adapter, with 5 OSTs devices from a disk array and 1 OST ramdisk device.
            Each disk array OST reaches 900 MiB/s write and 1100 MiB/s read with obdfilter-survey.

            Two Lustre versions have been tested: 2.5.57 and 1.8.8-wc1
            OSS cache is disabled (writethrough_cache_enable=0 and read_cache_enable=0)

            Benchmark
            IOR with following options:
            api=POSIX
            filePerProc=1
            blockSize=64G
            transferSize=1M
            numTasks=1
            fsync=1

            Server and client system cache is cleared before each write test and read test
            Tests are repeated 3 times, average value is computed.
            Tests are run as a standard user.

            Results
            With disk array OSTs, best results are achieved with a stripecount of 3.

            lustre version write read
            lustre 2.5.57 886 MiB/s 1020 MiB/s
            lustre 1.8.8-wc1 823 MiB/s 1135 MiB/s

            The write performance is under the 1GiB/s performance which was my goal. Do you think this is a performance we could achieve ? What tuning would you recommand ? I will provide monitoring data in attachment for one of the lustre 2.5.57 runs.

            As an element of comparison, the results with the ram device OST

            lustre version write read
            lustre 2.5.57 856 MiB/s 941 MiB/s
            lustre 1.8.8-wc1 919 MiB/s 1300 MiB/s

            Various tuning have been tested but give no improvement:
            IOR transferSize, llite max_cached_mb, OSS cache enabled.

            What makes a significant difference with lustre 2.5.57 is the write performance when test is run as root user, since it reaches 926 MiB/s (+4,5% compared to standard user). Should I open a separate ticket to track this difference ?

            Greg.

            pichong Gregoire Pichon added a comment - Hi Jinshan, Here are the results of the performance measurements I have done. Configuration Client is a node with 2 Ivybridge sockets (24 cores, 2.7GHz), 32GB memory, 1 FDR Infiniband adapter. OSS is a node with 2 Sandybridge sockets (16 cores, 2.2GHZ), 32GB memory, 1 FDR Infiniband adapter, with 5 OSTs devices from a disk array and 1 OST ramdisk device. Each disk array OST reaches 900 MiB/s write and 1100 MiB/s read with obdfilter-survey. Two Lustre versions have been tested: 2.5.57 and 1.8.8-wc1 OSS cache is disabled (writethrough_cache_enable=0 and read_cache_enable=0) Benchmark IOR with following options: api=POSIX filePerProc=1 blockSize=64G transferSize=1M numTasks=1 fsync=1 Server and client system cache is cleared before each write test and read test Tests are repeated 3 times, average value is computed. Tests are run as a standard user. Results With disk array OSTs, best results are achieved with a stripecount of 3. lustre version write read lustre 2.5.57 886 MiB/s 1020 MiB/s lustre 1.8.8-wc1 823 MiB/s 1135 MiB/s The write performance is under the 1GiB/s performance which was my goal. Do you think this is a performance we could achieve ? What tuning would you recommand ? I will provide monitoring data in attachment for one of the lustre 2.5.57 runs. As an element of comparison, the results with the ram device OST lustre version write read lustre 2.5.57 856 MiB/s 941 MiB/s lustre 1.8.8-wc1 919 MiB/s 1300 MiB/s Various tuning have been tested but give no improvement: IOR transferSize, llite max_cached_mb, OSS cache enabled. What makes a significant difference with lustre 2.5.57 is the write performance when test is run as root user, since it reaches 926 MiB/s (+4,5% compared to standard user). Should I open a separate ticket to track this difference ? Greg.
            jay Jinshan Xiong (Inactive) added a comment - - edited

            Hi Pichon,

            Now that you're asking, I assume the performance number didn't reach your expectation. Therefore I performed the test again with latest master to make sure everything is fine. Please collect statistic data on your node if this is the case, and I will take a look.

            I just performed the performance testing again on opensfs nodes with the following hardware configuration:

            Client nodes:

            [root@c01 lustre]# free
                         total       used       free     shared    buffers     cached
            Mem:      32870020   26477056    6392964          0     147936   21561448
            -/+ buffers/cache:    4767672   28102348
            Swap:     16506872          0   16506872
            [root@c01 lustre]# lscpu 
            Architecture:          x86_64
            CPU op-mode(s):        32-bit, 64-bit
            Byte Order:            Little Endian
            CPU(s):                8
            On-line CPU(s) list:   0-7
            Thread(s) per core:    2
            Core(s) per socket:    4
            Socket(s):             1
            NUMA node(s):          1
            Vendor ID:             GenuineIntel
            CPU family:            6
            Model:                 44
            Stepping:              2
            CPU MHz:               1600.000
            BogoMIPS:              4800.10
            Virtualization:        VT-x
            L1d cache:             32K
            L1i cache:             32K
            L2 cache:              256K
            L3 cache:              12288K
            NUMA node0 CPU(s):     0-7
            [root@c01 lustre]# lspci |grep InfiniBand
            03:00.0 InfiniBand: Mellanox Technologies MT26428 [ConnectX VPI PCIe 2.0 5GT/s - IB QDR / 10GigE] (rev b0)
            

            So the client node has 32G memory size and 4 Cores with 2 threads on each core. The network is Infiniband with 40Gb/s throughput.

            Server node is another client node with patch http://review.whamcloud.com/5164 applied. I used ramdisk as OST because we don't have fast disk array. Jeremy saw real performance improvement on their real disk storage. I disabled writethrough_cache_enable on the OST to avoid consuming too much memory on caching data.

            Here is the test result:

            [root@c01 lustre]# dd if=/dev/zero of=/mnt/lustre/testfile bs=1M count=40960
            40960+0 records in
            40960+0 records out
            42949672960 bytes (43 GB) copied, 39.5263 s, 1.1 GB/s
            [root@c01 lustre]# lfs getstripe /mnt/lustre/testfile 
            /mnt/lustre/testfile
            lmm_stripe_count:   1
            lmm_stripe_size:    1048576
            lmm_pattern:        1
            lmm_layout_gen:     0
            lmm_stripe_offset:  0
            	obdidx		 objid		 objid		 group
            	     0	             2	          0x2	             0
            

            I didn't do any configuration on the client node, even disable checksum. Also the snapshot of `collect -scml':

            [root@c01 ~]# collectl -scml
            waiting for 1 second sample...
            #<----CPU[HYPER]-----><-----------Memory-----------><--------Lustre Client-------->
            #cpu sys inter  ctxsw Free Buff Cach Inac Slab  Map  KBRead  Reads  KBWrite Writes
              20  20  5500  26162  18G 144M  10G   9G   1G  45M       0      0  1110016   1084
              24  24  5513  23691  17G 144M  11G  10G   1G  45M       0      0  1025024   1001
              20  20  5657  26083  15G 144M  12G  11G   2G  45M       0      0  1112064   1086
              21  21  5434  25963  14G 144M  13G  12G   2G  45M       0      0  1110016   1084
              20  20  5690  26326  13G 144M  14G  13G   2G  45M       0      0  1104896   1079
              21  21  5646  26094  11G 144M  15G  14G   2G  45M       0      0  1105920   1080
              21  21  5466  24678  10G 144M  16G  15G   3G  45M       0      0  1046528   1022
              20  20  5634  25563   9G 144M  17G  16G   3G  45M       0      0  1097728   1072
              20  20  5818  26008   8G 144M  18G  17G   3G  45M       0      0  1111040   1085
              20  20  5673  26467   6G 144M  20G  18G   3G  45M       0      0  1104896   1079
              24  24  6346  25027   6G 144M  20G  19G   4G  45M       0      0  1060864   1036
              33  32  7162  21258   6G 144M  20G  19G   4G  45M       0      0   960512    938
              28  28  7021  22865   6G 144M  20G  19G   4G  45M       0      0  1042432   1018
              28  28  7177  23890   6G 144M  20G  19G   4G  45M       0      0  1039360   1015
              28  28  7326  24888   6G 144M  20G  19G   4G  45M       0      0  1090560   1065
              28  28  7465  24162   6G 144M  20G  19G   4G  45M       0      0  1029120   1005
              31  31  7382  22865   6G 144M  20G  19G   4G  45M       0      0   980992    958
              28  28  7263  24392   6G 144M  20G  19G   4G  45M       0      0  1075200   1050
              28  28  7278  24312   6G 144M  20G  19G   4G  45M       0      0  1080320   1055
              28  28  7252  25150   6G 144M  20G  19G   4G  45M       0      0  1059840   1035
              28  28  7241  25082   6G 144M  20G  19G   4G  45M       0      0  1076224   1051
              33  32  7343  22373   6G 144M  20G  19G   4G  45M       0      0   966656    944
            #<----CPU[HYPER]-----><-----------Memory-----------><--------Lustre Client-------->
            #cpu sys inter  ctxsw Free Buff Cach Inac Slab  Map  KBRead  Reads  KBWrite Writes
              28  28  7340  24704   6G 144M  20G  19G   4G  45M       0      0  1091584   1066
              27  27  7212  24694   6G 144M  20G  19G   4G  45M       0      0  1055744   1031
              28  28  7191  24909   6G 144M  20G  19G   4G  45M       0      0  1073152   1048
              28  28  7257  25058   6G 144M  20G  19G   4G  45M       0      0  1037312   1013
              33  33  7435  22787   6G 144M  20G  19G   4G  45M       0      0   988160    965
              28  28  6961  23635   6G 144M  20G  19G   4G  45M       0      0  1044480   1020
              27  27  7129  24866   6G 144M  20G  19G   4G  45M       0      0  1045504   1021
              28  27  7024  24380   6G 144M  20G  19G   4G  45M       0      0  1053666   1029
              28  28  7058  24489   6G 144M  20G  19G   4G  45M       0      0  1041426   1017
              33  33  7234  22235   6G 144M  20G  19G   4G  45M       0      0   970752    948
              27  27  7127  24555   6G 144M  20G  19G   4G  45M       0      0  1067008   1042
              28  28  7189  24215   6G 144M  20G  19G   4G  45M       0      0  1082368   1057
              28  28  7201  24734   6G 144M  20G  19G   4G  45M       0      0  1064960   1040
              27  27  7046  24564   6G 144M  20G  19G   4G  44M       0      0  1040384   1016
               0   0    67    110   6G 144M  20G  19G   4G  44M       0      0        0      0
               0   0    63    113   6G 144M  20G  19G   4G  44M       0      0        0      0
            

            Does the dd test include a final fsync of data to storage ?

            No I didn't but I don't think this will affect the result because I ran dd with 1M block so the dirty data will be sent out immediately.

            jay Jinshan Xiong (Inactive) added a comment - - edited Hi Pichon, Now that you're asking, I assume the performance number didn't reach your expectation. Therefore I performed the test again with latest master to make sure everything is fine. Please collect statistic data on your node if this is the case, and I will take a look. I just performed the performance testing again on opensfs nodes with the following hardware configuration: Client nodes: [root@c01 lustre]# free total used free shared buffers cached Mem: 32870020 26477056 6392964 0 147936 21561448 -/+ buffers/cache: 4767672 28102348 Swap: 16506872 0 16506872 [root@c01 lustre]# lscpu Architecture: x86_64 CPU op-mode(s): 32-bit, 64-bit Byte Order: Little Endian CPU(s): 8 On-line CPU(s) list: 0-7 Thread(s) per core: 2 Core(s) per socket: 4 Socket(s): 1 NUMA node(s): 1 Vendor ID: GenuineIntel CPU family: 6 Model: 44 Stepping: 2 CPU MHz: 1600.000 BogoMIPS: 4800.10 Virtualization: VT-x L1d cache: 32K L1i cache: 32K L2 cache: 256K L3 cache: 12288K NUMA node0 CPU(s): 0-7 [root@c01 lustre]# lspci |grep InfiniBand 03:00.0 InfiniBand: Mellanox Technologies MT26428 [ConnectX VPI PCIe 2.0 5GT/s - IB QDR / 10GigE] (rev b0) So the client node has 32G memory size and 4 Cores with 2 threads on each core. The network is Infiniband with 40Gb/s throughput. Server node is another client node with patch http://review.whamcloud.com/5164 applied. I used ramdisk as OST because we don't have fast disk array. Jeremy saw real performance improvement on their real disk storage. I disabled writethrough_cache_enable on the OST to avoid consuming too much memory on caching data. Here is the test result: [root@c01 lustre]# dd if=/dev/zero of=/mnt/lustre/testfile bs=1M count=40960 40960+0 records in 40960+0 records out 42949672960 bytes (43 GB) copied, 39.5263 s, 1.1 GB/s [root@c01 lustre]# lfs getstripe /mnt/lustre/testfile /mnt/lustre/testfile lmm_stripe_count: 1 lmm_stripe_size: 1048576 lmm_pattern: 1 lmm_layout_gen: 0 lmm_stripe_offset: 0 obdidx objid objid group 0 2 0x2 0 I didn't do any configuration on the client node, even disable checksum. Also the snapshot of `collect -scml': [root@c01 ~]# collectl -scml waiting for 1 second sample... #<----CPU[HYPER]-----><-----------Memory-----------><--------Lustre Client--------> #cpu sys inter ctxsw Free Buff Cach Inac Slab Map KBRead Reads KBWrite Writes 20 20 5500 26162 18G 144M 10G 9G 1G 45M 0 0 1110016 1084 24 24 5513 23691 17G 144M 11G 10G 1G 45M 0 0 1025024 1001 20 20 5657 26083 15G 144M 12G 11G 2G 45M 0 0 1112064 1086 21 21 5434 25963 14G 144M 13G 12G 2G 45M 0 0 1110016 1084 20 20 5690 26326 13G 144M 14G 13G 2G 45M 0 0 1104896 1079 21 21 5646 26094 11G 144M 15G 14G 2G 45M 0 0 1105920 1080 21 21 5466 24678 10G 144M 16G 15G 3G 45M 0 0 1046528 1022 20 20 5634 25563 9G 144M 17G 16G 3G 45M 0 0 1097728 1072 20 20 5818 26008 8G 144M 18G 17G 3G 45M 0 0 1111040 1085 20 20 5673 26467 6G 144M 20G 18G 3G 45M 0 0 1104896 1079 24 24 6346 25027 6G 144M 20G 19G 4G 45M 0 0 1060864 1036 33 32 7162 21258 6G 144M 20G 19G 4G 45M 0 0 960512 938 28 28 7021 22865 6G 144M 20G 19G 4G 45M 0 0 1042432 1018 28 28 7177 23890 6G 144M 20G 19G 4G 45M 0 0 1039360 1015 28 28 7326 24888 6G 144M 20G 19G 4G 45M 0 0 1090560 1065 28 28 7465 24162 6G 144M 20G 19G 4G 45M 0 0 1029120 1005 31 31 7382 22865 6G 144M 20G 19G 4G 45M 0 0 980992 958 28 28 7263 24392 6G 144M 20G 19G 4G 45M 0 0 1075200 1050 28 28 7278 24312 6G 144M 20G 19G 4G 45M 0 0 1080320 1055 28 28 7252 25150 6G 144M 20G 19G 4G 45M 0 0 1059840 1035 28 28 7241 25082 6G 144M 20G 19G 4G 45M 0 0 1076224 1051 33 32 7343 22373 6G 144M 20G 19G 4G 45M 0 0 966656 944 #<----CPU[HYPER]-----><-----------Memory-----------><--------Lustre Client--------> #cpu sys inter ctxsw Free Buff Cach Inac Slab Map KBRead Reads KBWrite Writes 28 28 7340 24704 6G 144M 20G 19G 4G 45M 0 0 1091584 1066 27 27 7212 24694 6G 144M 20G 19G 4G 45M 0 0 1055744 1031 28 28 7191 24909 6G 144M 20G 19G 4G 45M 0 0 1073152 1048 28 28 7257 25058 6G 144M 20G 19G 4G 45M 0 0 1037312 1013 33 33 7435 22787 6G 144M 20G 19G 4G 45M 0 0 988160 965 28 28 6961 23635 6G 144M 20G 19G 4G 45M 0 0 1044480 1020 27 27 7129 24866 6G 144M 20G 19G 4G 45M 0 0 1045504 1021 28 27 7024 24380 6G 144M 20G 19G 4G 45M 0 0 1053666 1029 28 28 7058 24489 6G 144M 20G 19G 4G 45M 0 0 1041426 1017 33 33 7234 22235 6G 144M 20G 19G 4G 45M 0 0 970752 948 27 27 7127 24555 6G 144M 20G 19G 4G 45M 0 0 1067008 1042 28 28 7189 24215 6G 144M 20G 19G 4G 45M 0 0 1082368 1057 28 28 7201 24734 6G 144M 20G 19G 4G 45M 0 0 1064960 1040 27 27 7046 24564 6G 144M 20G 19G 4G 44M 0 0 1040384 1016 0 0 67 110 6G 144M 20G 19G 4G 44M 0 0 0 0 0 0 63 113 6G 144M 20G 19G 4G 44M 0 0 0 0 Does the dd test include a final fsync of data to storage ? No I didn't but I don't think this will affect the result because I ran dd with 1M block so the dirty data will be sent out immediately.

            Could you provide the details of the configuration where you made your measurements (client node socket, memory size, network interface, max_cached_mb setting, other client tuning, OSS node and OST storage, file striping, io size, RPC size) ?

            Does the dd test include a final fsync of data to storage ?

            Do you have performance results with a version of Lustre after all the patches have been landed ?

            thanks.

            pichong Gregoire Pichon added a comment - Could you provide the details of the configuration where you made your measurements (client node socket, memory size, network interface, max_cached_mb setting, other client tuning, OSS node and OST storage, file striping, io size, RPC size) ? Does the dd test include a final fsync of data to storage ? Do you have performance results with a version of Lustre after all the patches have been landed ? thanks.

            People

              jay Jinshan Xiong (Inactive)
              jfilizetti Jeremy Filizetti
              Votes:
              0 Vote for this issue
              Watchers:
              23 Start watching this issue

              Dates

                Created:
                Updated:
                Resolved: